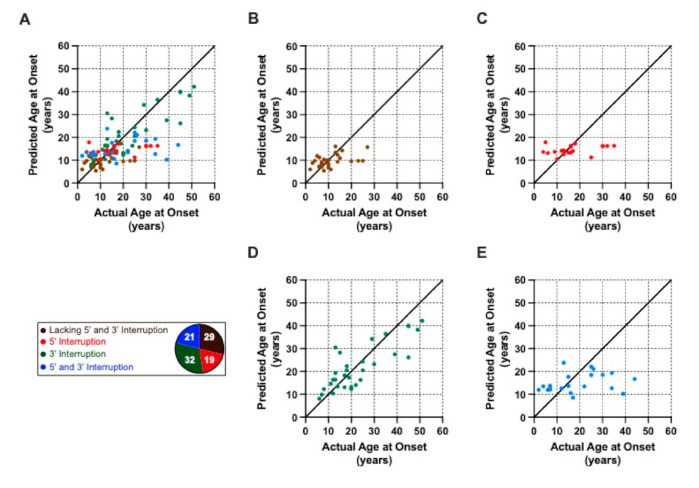
Figure 4.
Predicted versus actual ages at disease onset for a given number of GAA1 repeats. (A) Actual and predicted ages at disease onset for the whole FRDA cohort (n = 101). The subgroup membership is colour-coded according to the legend, which also indicates the number of patients per subgroup. (B–E) show the predicted versus actual age at disease onset for each subgroup separately. In each graph, the solid black line indicates identical predicted and actual ages at disease onset.

