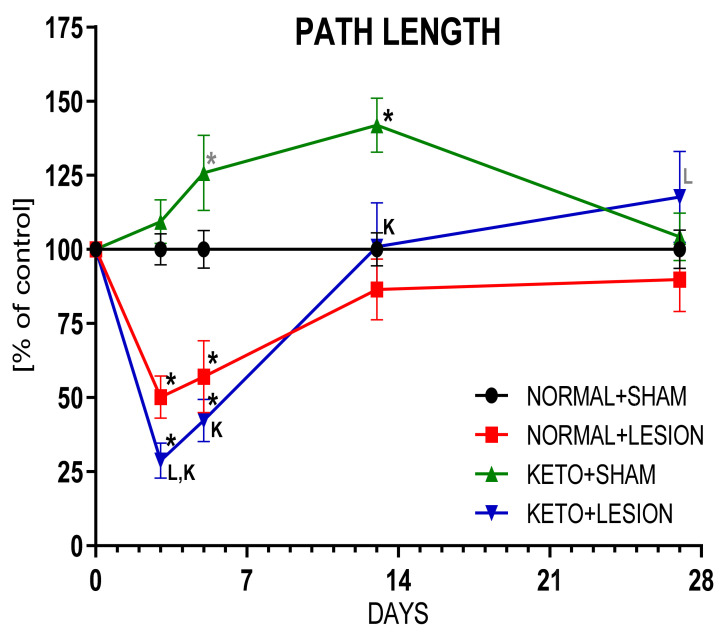
Figure 3.
Locomotor activity of rats. Data presented as path length measured in actometers, showed as % of control ± SEM of the respective day. Analysis was performed at time-points 3, 5, 13, 27 days after brain surgery. Animals were kept on ketogenic diet for 3 weeks in advance. p value ≤ 0.05 was set as significance threshold and marked as * vs. normal diet + sham, L vs. normal diet + 6-OHDA lesion, K vs. ketogenic diet + sham. Statistical trends 0.05 < p ≤ 0.1 were marked in grey symbols. Repeated measure ANOVA with LSD post hoc test for analysis in time and 3-way ANOVA with LSD post hoc test for analysis of total values were performed. Number of animals in groups was: for 3 days, n = 19–26; for 5 days, n = 8–12; for 13 days, n = 9–16; for 27 days, n = 8–14.

