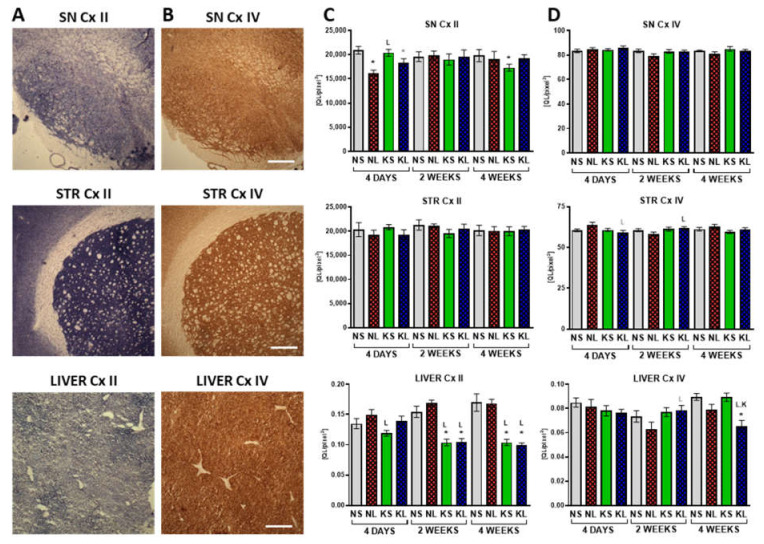
Figure 7.
Cx II (A,C) and Cx IV (B,D) staining in brain and liver, representative photographs (A,B) and quantification (C,D). Staining was performed on tissue sections from SN and STR and liver as Relative Optical Density (ROD). Data are presented as mean ± SEM. Analysis was performed at time-points 4 days, 2 weeks, and 4 weeks after brain surgery. Animals were kept on ketogenic diet for 3 weeks in advance. p value ≤ 0.05 was set as significance threshold and marked as * vs. normal diet + sham (NS group), L vs. normal diet + 6-OHDA lesion (NL group), K vs. ketogenic diet + sham (KS group), KL stands for ketogenic diet + 6-OHDA lesion group. Statistical trends 0.05 < p ≤ 0.1 were marked in grey symbols. Statistics: 3-way ANOVA with LSD post hoc test. Number of animals was 5–7 per group. Scale bar represents 400 µm.

