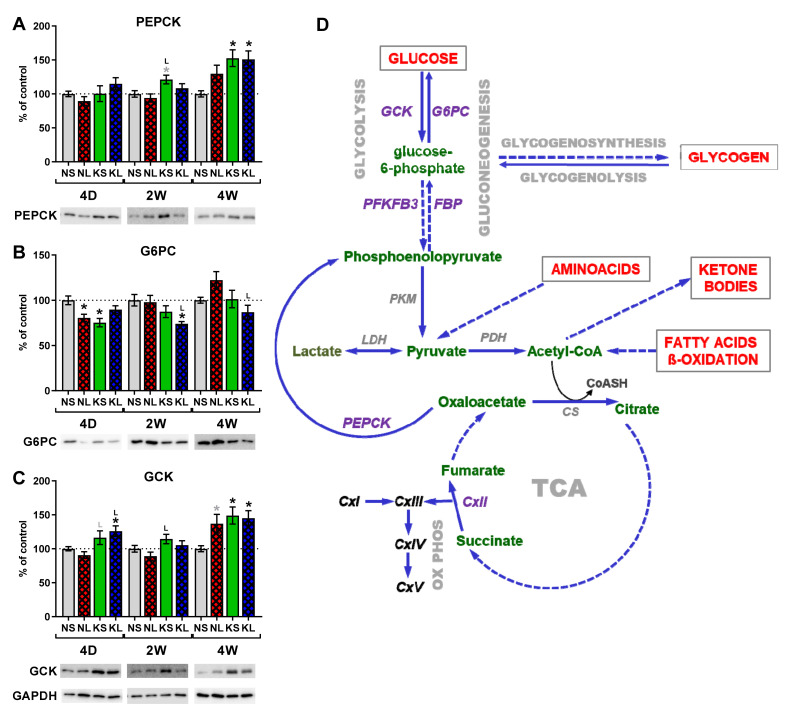
Figure 8.
Protein expression in liver, (A–C) Western blot and schematics of liver energy metabolism (D). Analysis was performed on liver homogenates in triplicate for each animal, from n = 6 animals per group. Data are presented in % of control as mean ± SEM. Analysis was performed at time-points 4 days, 2 weeks, and 4 weeks after brain surgery. Animals were kept on ketogenic diet for 3 weeks in advance. p value ≤ 0.05 was set as significance threshold and marked as * vs. normal diet + sham (NS group), L vs. normal diet + 6-OHDA lesion (NL group), K vs. ketogenic diet + sham (KS group), KL stands for ketogenic diet + 6-OHDA lesion group. Statistical trends 0.05 < p ≤ 0.1 were marked in grey symbols. Statistics: 3-way ANOVA with LSD post hoc test. (C) Liver energy metabolism. Full arrows indicate direct processes, while dashed arrows indirect, with additional processes in-between. CS—citrate synthase; FBP—fructose 1,6-bisphosphatase; G6PC—glucose-6-phosphatase; GCK—glucokinase; LDH—lactate dehydrogenase; OxPhos—oxidative phosphorylation; PDH—pyruvate dehydrogenase; PEPCK—phosphoenolpyruvate carboxykinase; PFKFB3—6-phosphofructo-2-kinase/fructose-2,6-biphosphatase 3; PKM—pyruvate kinase; TCA—tricarboxylic acid cycle.

