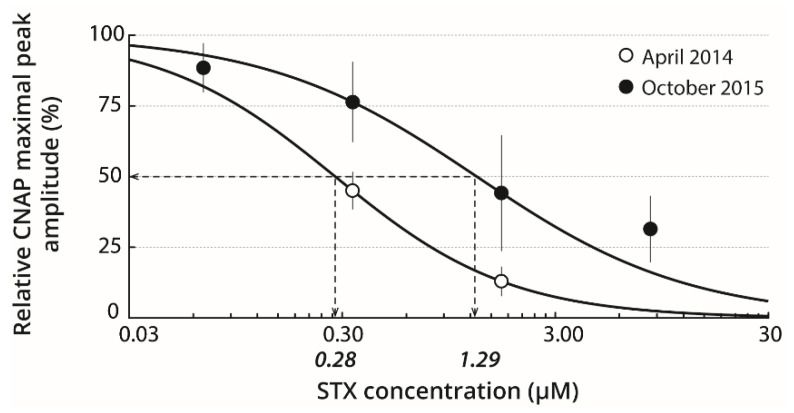
Figure 2.
STX sensitivity of nerves isolated from wild oysters. Concentration-response curves of STX effects on the CNAP maximal peak amplitude recorded from wild oysters collected on April 2014 (○) and October 2015 (●). Each value represents the mean ± SE of data obtained from 2 to 9 nerves, and is expressed as percentage of its value obtained in absence of toxin. The curves were calculated from typical sigmoid nonlinear regressions through data points, according to the Hill equation, with IC50 values (italic numbers) of 0.28 and 1.29 µM and nH values of 1.06 and 0.87 for nerves isolated from oysters collected on April 2014 and October 2015, respectively.

