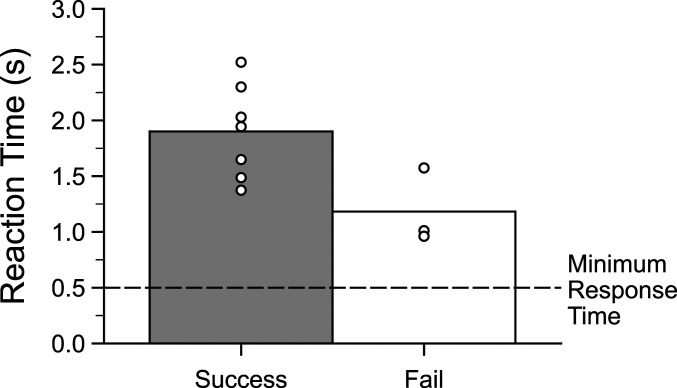
Fig. 3.
Reaction times of successful and unsuccessful discrimination of isochronous versus arrhythmic stimuli. Mean response time for the last 500 responses in each training phase for birds trained to discriminate sequences based on rhythmic pattern (left bar: n = 7 birds which completed training and probe testing; right bar: n = 3 birds which did not reach performance criterion during training). The horizontal line indicates the 0.5 s time between the trial start and response switch activation when subjects could not make a response. Data points indicate the average reaction time for each bird; the conventions are as in Fig. 2.

