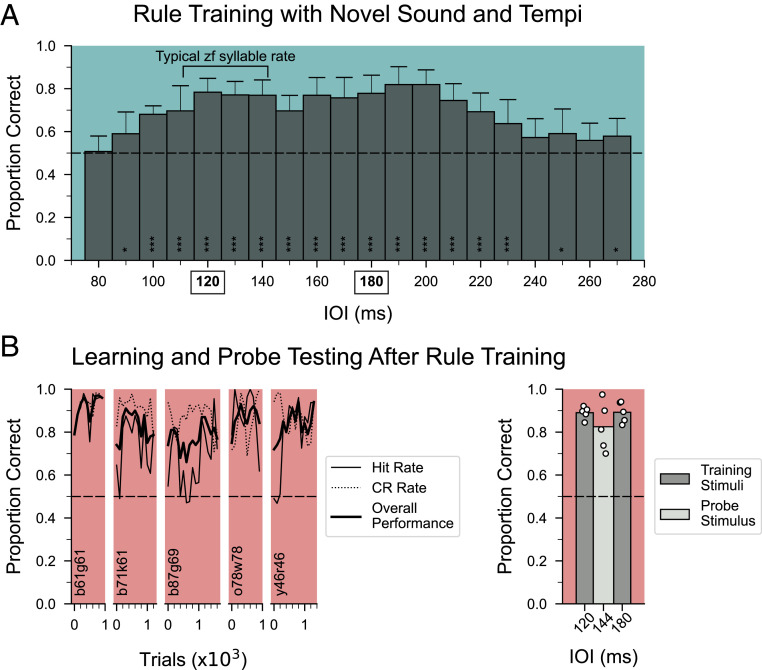
Fig. 4.
Rule training results and subsequent training and testing results with a novel stimulus. (A) Average performance of the first 1,000 trials of rule training across birds that completed rhythmic pattern discrimination training (n = 7). Bars represent performance in 10-ms bins; error bars denote SD. The dashed horizontal line shows chance performance. Performance for binned IOIs between 95 and 235 ms are significantly different from performance during the 75 to 85 ms IOIs, which was not different from chance (***P < 0.001; *P < 0.05, mixed-effect logistic regression). The rates used in discrimination training prior to rule training are indicated in the x-axis with bold and boxes. (B, Left) Learning curves of five birds that learned a novel stimulus set (sound E) after completing rule training, plotted in 100-trial bins. All five learned the stimuli to criteria in the minimum possible time. (Right) Performance during probe testing for sound E was significantly different from chance for all five birds (P < 0.001, binomial test). The conventions are as in Fig. 2. In both A and B, sound type is indicated by the color following the conventions in Fig. 1D.

