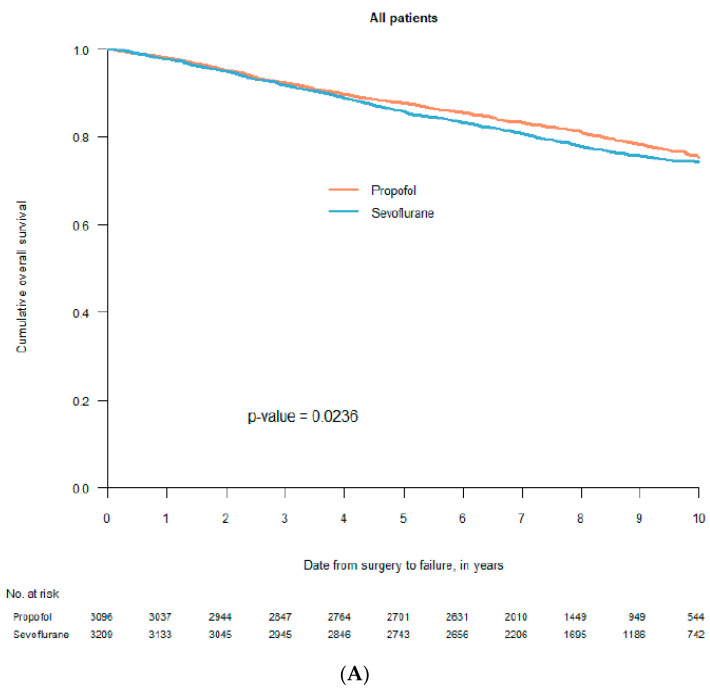
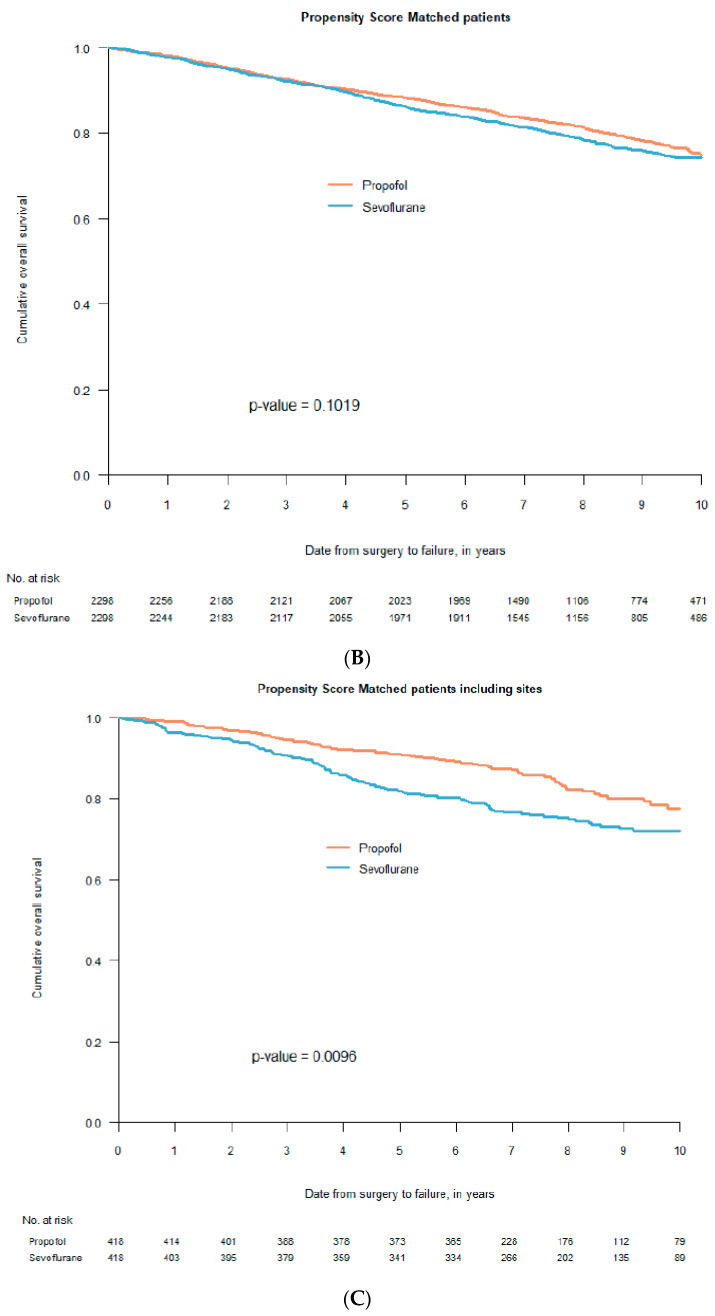
Figure 2.
Kaplan–Meier curves for survival after propofol- or sevoflurane-based anaesthesia. Graph (A) includes all 6305 patients before statistical adjustments; graph (B) includes 2298 pairs after propensity score match without the seven participating clinics included as a co-factor in the statistical analysis; graph (C) includes 418 pairs after propensity score match with the seven participating clinics included in the statistical analysis (with permission from Acta Anaesthesiologica Scandinavica, Wiley; reference [61]).


