Table 1.
Blood–brain barrier in vitro models (transwell).
| Citation | Experiment Conditions * | Main Readouts ** |
|---|---|---|
| Lippmann et al. 2012 [38] |
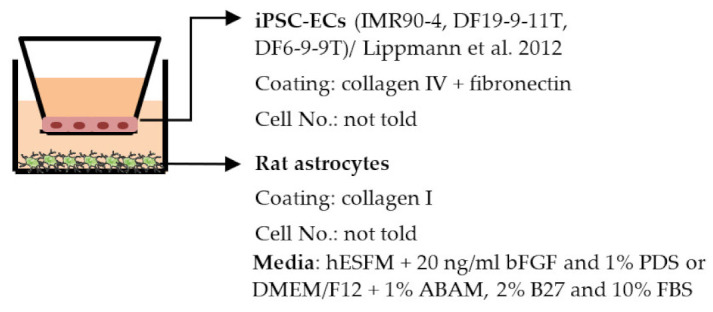
|
TEER (Ω × cm2) Monoculture: 222 Co-culture: 1450, (IMR90-4), 777 (DF19-9-11T) |
| Lippmann et al. 2014 [191] |
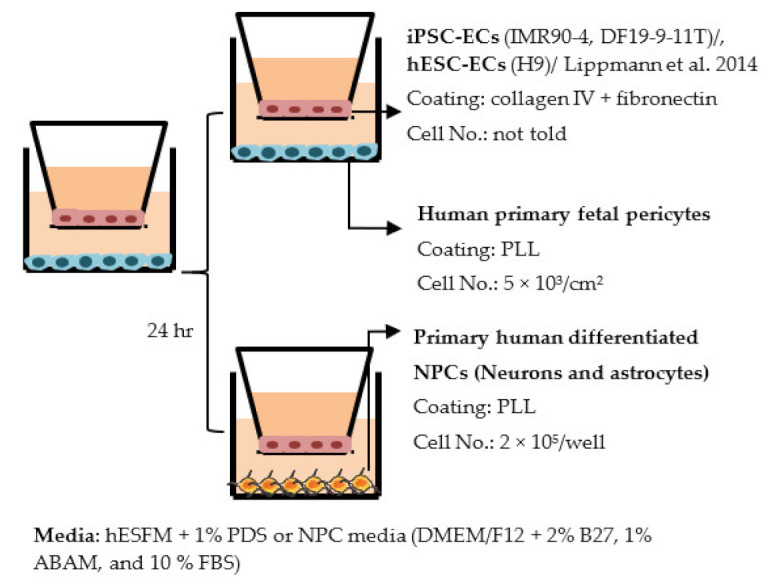
|
TEER (Ω × cm2) Monocultures: 3670 (IMR90-4), 1970 (DF19-9-11T), 1030 (hESC) Co-cultures: IMR90-4-ECs: 4450 (+pericytes), 5350 (+pericytes and NPCs) DF19-9-11T-ECs: 4740 (+pericytes and NPCs) hESC-ECs: 1680 (+pericytes and NPCs) |
| Qian et al. 2017 [192] |
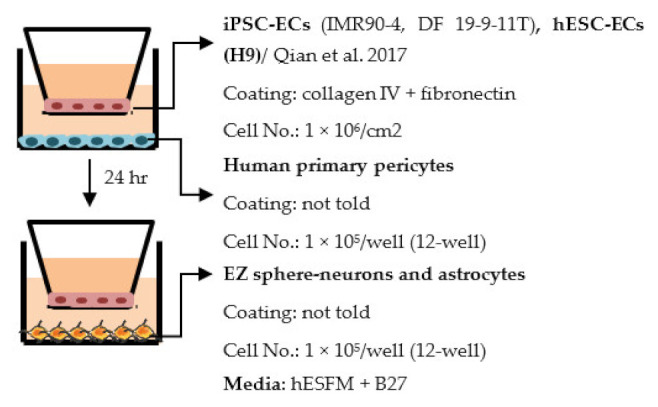
|
TEER (Ω × cm2) Monocultures: 3315 (IMR90-4), 1980 (H9), 3571 (DF19-9-11) Co-culture: ~30% increase compared to monoculture |
| Hollmann et al. 2017 [193] |

|
TEER (Ω × cm2) Monoculture: 4227 Co-cultures: 5378 (+astrocytes), 5937 (+pericytes), 6635 (+astocytes, pericytes) Permeability, NaF (Pe × 10−7 cm/s) Monoculture: less than 1.97 in all lines |
| Appelt-Menzel et al. 2017 [225] |

|
Max TEER (Ω × cm2) Monoculture: 2073 Co-cultures: 2024 (+primary astrocytes), 2485 (+iPSC-astrocytes), 2107 (+pericytes), 2171 (+hiPS-NSCs) Triple cultures: 2105 (+primary astrocytes, pericytes), 2293 (+primary astrocytes, hiPS-NSCs), 2556 (+pericytes, hiPS-NSCs) Quadruple cultures: 2489 (+primary astrocytes, pericytes and hiPS-NSCs) Permeability coefficient (µm/min) Monoculture: 1.52 (LY), 1.53 (fluorescein), 0.0166 (Dextran, 4 kDa), 0.0054 (Dextran, 40 kDa) Quadruple culture: 1.58 (LY), 1.33 (fluorescein), 0.0106 (Dextran, 4 kDa), 0.0030 (Dextran, 40 kDa) Other ↑ SLC2A1 in quadruple culture |
| Canfield et al. 2017 [224] |

|
TEER (Ω × cm2) Monoculture: 153 Co-cultures: 491 (+neurons), 558 (+astrocytes), 611 (+NCPs), 784 (+primary astrocytes) Triple cultures: 661 (+neuron − astrocytes, 1:1), 886 (+neuron − astrocytes, 1:3) Permeability, NaF (Pe × 10−7 cm/s) Monoculture: 4.8 Co-cultures: 2.0 (+NCPs), 1.9 (+primary astrocytes) Triple cultures: 1.20 (+ neuron − astrocyte 1:3) Other Triple culture (neuron − astrocyte 1:3) increased TJ localization in iPSC-ECs, no change in transporter expression |
| Delsing et al. 2018 [199] |
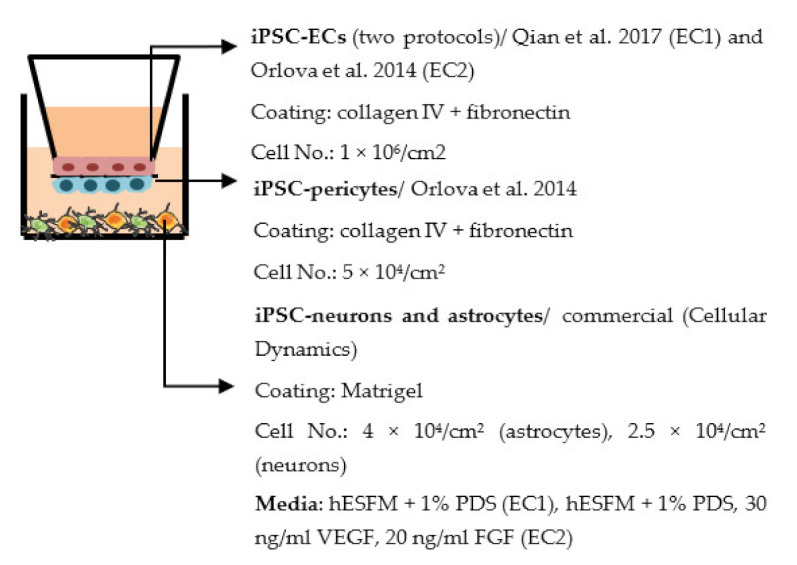
|
TEER (Ω × cm2) Monoculture: 773 (EC1), 52 (EC2) Co-culture: 1267 (EC1), 150 (EC2) Permeability Decreased NaF permeability in co-culture (EC1), exact values not told Other Changed gene expression in iPSC-ECs after co-culture: ↑ BCRP (EC1, EC2), ↑ P-gp (EC1), ↑ Glut1 (EC2), ↓ VE-cadherin (EC1), ↓ Caveolin 1 (EC1, EC2), ↑ occludin (EC2) |
| Neal et al. 2019 [194] |
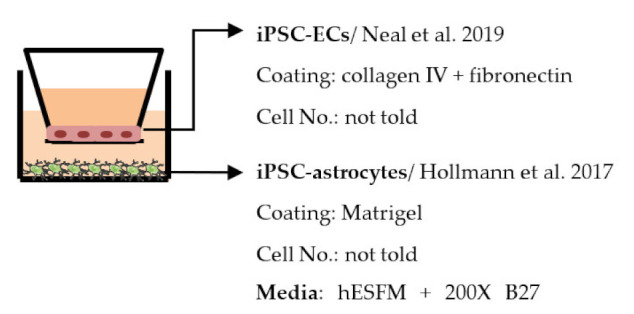
|
Max TEER (Ω × cm2) Monoculture: 8734 Co-culture: above 9000 Permeability, NaF (Pe × 10−7 cm/s) Monoculture: less than 2.5 |
| Stebbins et al. 2019 [210] |
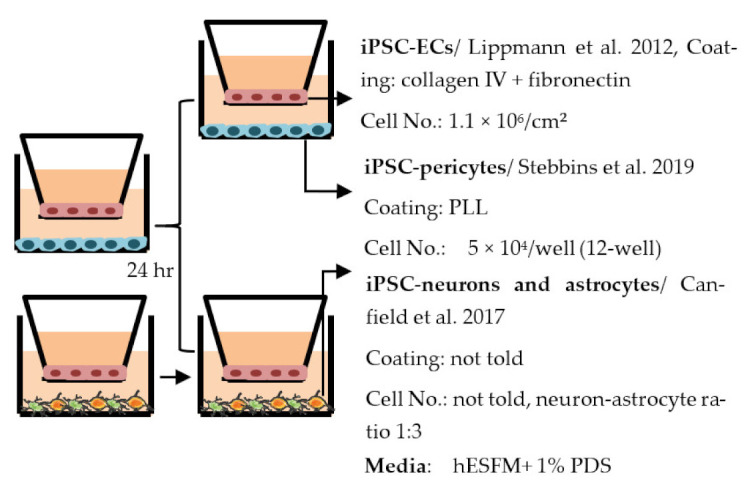
|
TEER (Ω × cm2) Monoculture: ≈300 (exact values not shown) Co-culture: 720 (+neurons and astrocytes), 503 (+pericyte), 1156 (+pericytes, astrocytes, and neurons) Permeability (Pe × 10−6 cm/s), NaF Monoculture: ≈6 Co-cultures: Five-fold decrease (exact values not shown) |
| Jamieson et al. 2019 [215] |
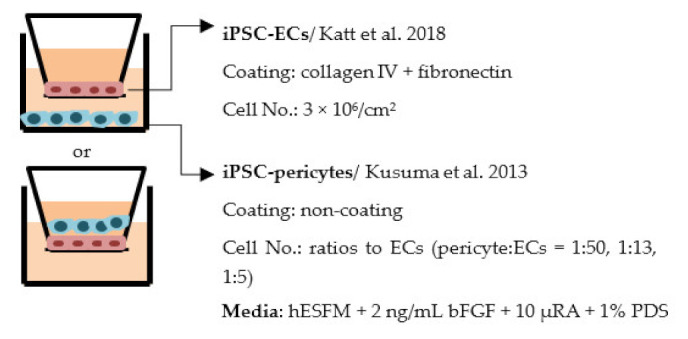
|
TEER (Ω × cm2) Monoculture: 3510 Co-culture (non-contact): 3690 (1:50), 3600 (1:13), 3690 (1:5) Co-culture (contact, in gel): 2410 (1:13) |
| Faal et al. 2019 [209] |
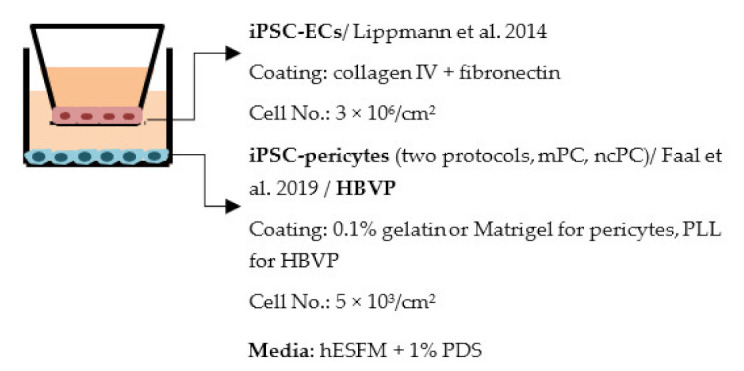
|
TEER Exact values not told, pericytes increased TEER values in co-culture. |
| Praça et al. 2019 [195] |
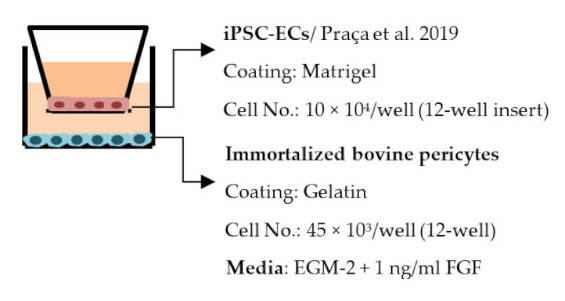
|
TEER (Ω × cm2) Mono- and co-culture: ≈60, exact values not told Permeability, LY (Pe × 10−3 cm/min) ≈0.5, Slight decrease in co-culture compared to optimized monoculture |
| Blanchard et al. 2020 [107] |
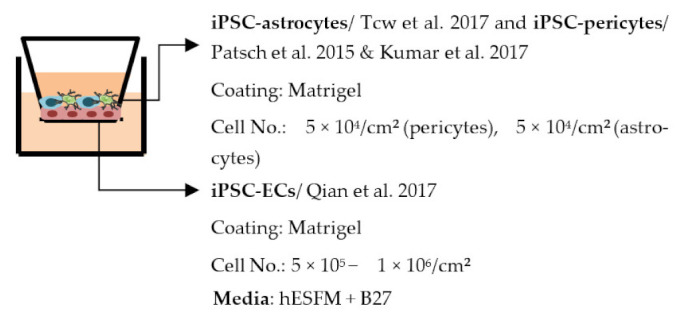
|
Average TEER (Ω × cm2) Monoculture: ≈5900 iBBB: ≈8300 Permeability, Dextran Values not told, decreased permeability in co-culture Other ↑ P-gp in co-culture |
| Nishihara et al. 2020 [198] |
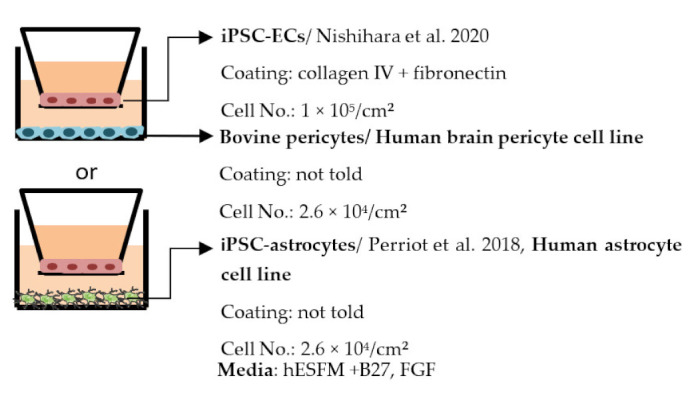
|
TEER (Ω × cm2) Monoculture: above 60 Co-culture: similar to monoculture Permeability, NaF (Pe × 10−3 cm/min) Monoculture: below 0.32 Co-culture: similar to monoculture Other more elongated morphology of ECs in co-culture compared to monoculture |

| ||
Abbreviations: BBB—Blood–brain barrier; EC—Endothelial cells; ESC—Embryonic stem cell; FBS—Fetal bovine serum; FGF—Fibroblast growth factor; HBVP—Human brain vascular pericytes; hESFM—Human endothelial serum free media; iBBB—iPSC-derived BBB; LY—Lucifer yellow; NaF—Sodium fluoride; NPC—Neural progenitor cell; NSC—Neural stem cell; PDS—platelet-poor plasma-derived serum; PLL—Poly-L-Lysine; RA—Retinoic acid; TEER—Transendothelial electrical resistance; VEGF—Vascular endothelial growth factor; ABAM—Antibiotic–antimycotic. * Describing co-culture conditions, unless otherwise mentioned; ** Only results from healthy lines included.
