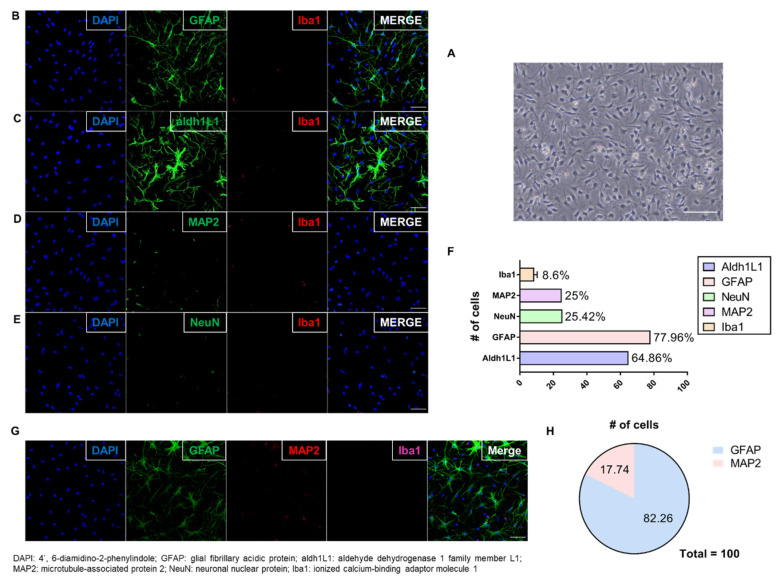
Figure 2.
Verifying the Culture of Astrocytes. (A) Differential Interference Contrast microscopy image showing cultured astrocytes with stellate morphology on DIV14 (scale bar: 50 μm); (B–E) Dual immunofluorescent image showing that most cells expressed astrocyte markers (GFAP and aldh1L1); fewer expressed Iba1 (microglia), NeuN, and MAP2 (neurons) (scale bar: 50 μm); (F) Among every 100 cells, 60–80 expressed astrocyte markers (aldh1L1 or GFAP), and 20 expressed neuronal cell markers (NeuN or MAP2). The remaining cells expressed a microglia marker (Iba1). (No error bar due to one cell type group each); (G) Triple immunofluorescent image showing that most cells expressed GFAP (astrocytes); fewer expressed MAP2 (neurons). Expression of Iba1 (microglia) was not detected (scale bar: 50 μm); (H) Plots analysis showing similar results to dual staining. Microglia (Iba1) was not plotted because of no detection. The graph shows that the cell culture in this study was dominated by astrocytes.

