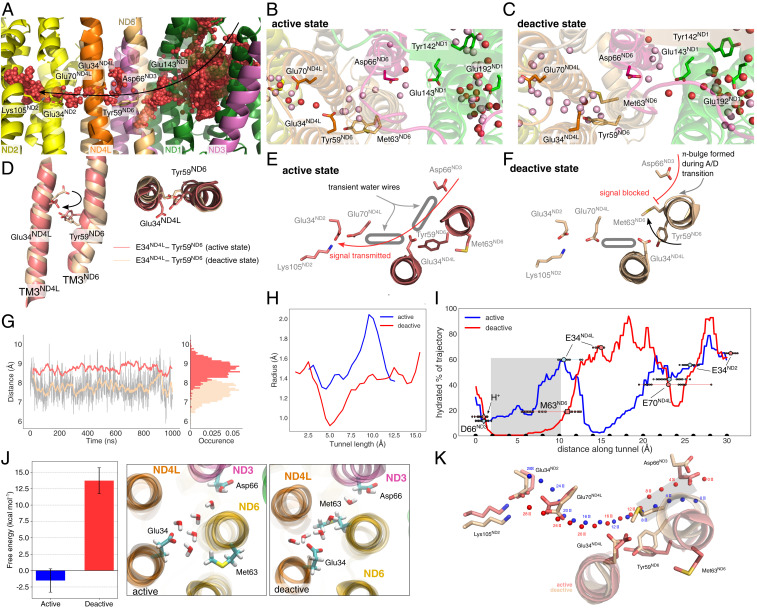
Fig. 2.
Hydration dynamics in the “active” and “deactive” states. (A) Ensemble average of water molecules during 1,000-ns MD simulations of the “active” state. The water molecules form an effective proton wire via the E-channel in ND1 and connect via the ND3/ND4L/ND6 region to the ND2 interface. (B and C) Snapshot of individual water molecules (in red) after the 1,000-ns MD simulations in the ND1/ND3/ND4L/ND6 region in the “active” (B) and “deactive” (C) states. Water molecules in pink are obtained from simulations with shifted protonation states (simulations S19 and S23; SI Appendix, Table S1). Refer also to SI Appendix, Fig. S6 for cluster analysis. (D) Rotation of TM3ND4L/ND6 helices induce conformational changes around Glu34ND4L/Tyr59ND6 in the “active” (red) and “deactive” (brown) states. Proton wires are established from Asp66ND3 via Glu34ND4L to Glu70ND4L and further to the Glu34/Lys105 ion pair of ND2 in the "active" state (E), but are blocked in the "deactive" state (F). (G) Dynamics of the Glu34ND4L/Tyr59ND6 during the “active” (red) and “deactive” (brown) states. (H) Tunnel radius connecting Asp66ND3 and Glu34ND4L in the “active” and “deactive” state simulations, predicted using CAVER tunnel analysis (Materials and Methods). (I) Hydration fraction along the tunnels connecting the acidic residues along the ND3/ND6/ND4L/ND2 gating region. The tunnel distances correspond to the beads shown in K. (J) (Left) Hydration free energy for introducing a water wire in the gating region between Asp66ND3 and Glu34ND4L, obtained using alchemical FEP simulations, suggesting that the formation of a water wire in the “deactive” state is disfavored by ca. 15 kcal · mol−1 as compared to the “active” state. Error bars indicate a 95% CI based on three independent simulations (SI Appendix, SI Methods). (Middle/Right) Snapshots of the fully formed water wires in the “active” and “deactive” states during the FEP calculations. (K) Tunnel positions shown in panel I relative to the structure in the “active” and “deactive” states. Beads are placed 2 Å apart to highlight the channel pathway.

