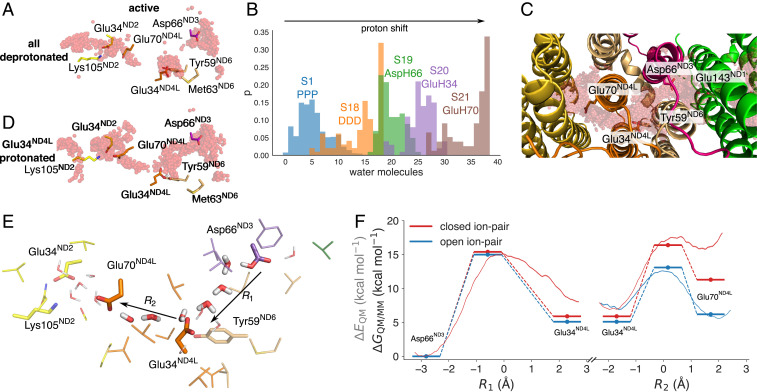
Fig. 3.
Proton transfer in the ND3/ND4L/ND6 deactivation gate. (A) Proton pathways from Asp66ND3 via Glu34ND4L to Glu70ND4L and the Glu34ND2/Lys105ND2 ion pair of ND2. (B) Shifting the protonation state in the ND4L/ND6/ND3 region favors enhanced hydration and hydrogen-bonded wiring between the putative membrane-bound Q-site and the ND2 interface (see SI Appendix, Table S1). The figure shows the count of water molecules between the tunnel region extending from ND3 to ND2 (C) during the MD simulations of each state. The distributions are normalized to 1. (C) Top view of the gating region and ensemble average of water molecules in simulations S18 to S21 (SI Appendix, Table S1). (D) Shifting the proton to Glu34ND4L enhances water-mediated contacts to Glu70ND4L. Refer also to SI Appendix, Fig. S5 for exploration of different protonation states in the MD simulations. (E) Residues surrounding the ND3/ND4L/ND6 water chain that were included in the quantum chemical DFT and QM/MM free energy calculations. (F) Proton transfer energetics based on QM/MM free energy simulations (red/blue lines) and quantum chemical DFT models (energy level diagrams) and effect of the ND2 ion pair conformation on the proton transfer profile. Reaction coordinates obtained from the DFT models are marked with a filled circle. Statistical errors in the free energy profiles are ca. 0.12 kcal · mol−1 (transparent red), and the effects of DFT-sampling on the convergence of the free energy profiles are shown in SI Appendix, Fig. S8. Benchmarking calculations suggest that the transition states and reaction energies have a few kcal · mol−1 error relative to correlated ab initio calculations (SI Appendix, Table S7).

