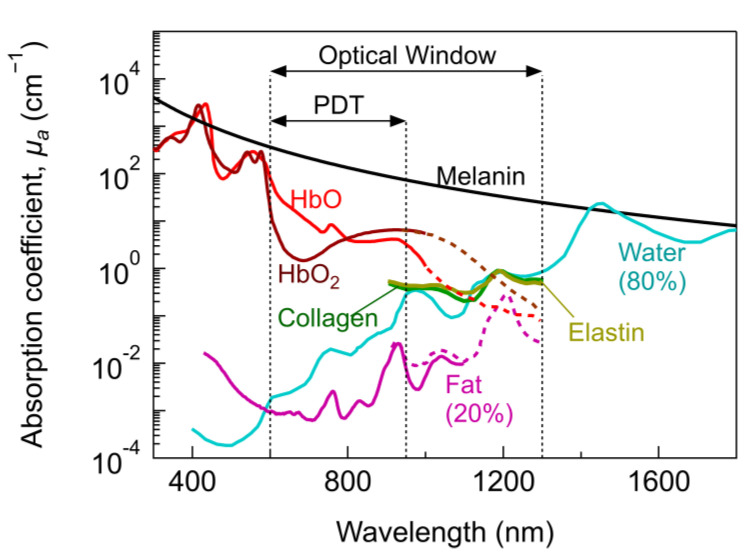
Figure 1.
Absorption coefficient as a function of wavelength for several tissue constituents. Data for HbO (150 g/L), HbO2 (150 g/L) and melanin are taken from [23]. Purified pig and human (dashed lines) fat from [24] and [25], respectively. Water from [26]. Collagen and elastin from [25]. HbO2 and HbO shown as dashed lines are taken from [27] (adjusted to match the data at 1000 nm).

