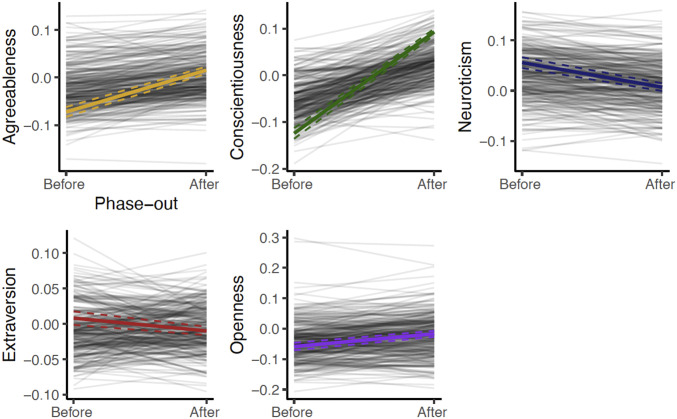
Fig. 2.
Change in personality before and after lead phase out in 269 US counties (n = 1,219,290). Colored lines depict the model-implied before–after shift in personality traits across all counties, with a dashed 95% CI. The gray lines depict model-implied shifts in each county. The scores are standardized.

