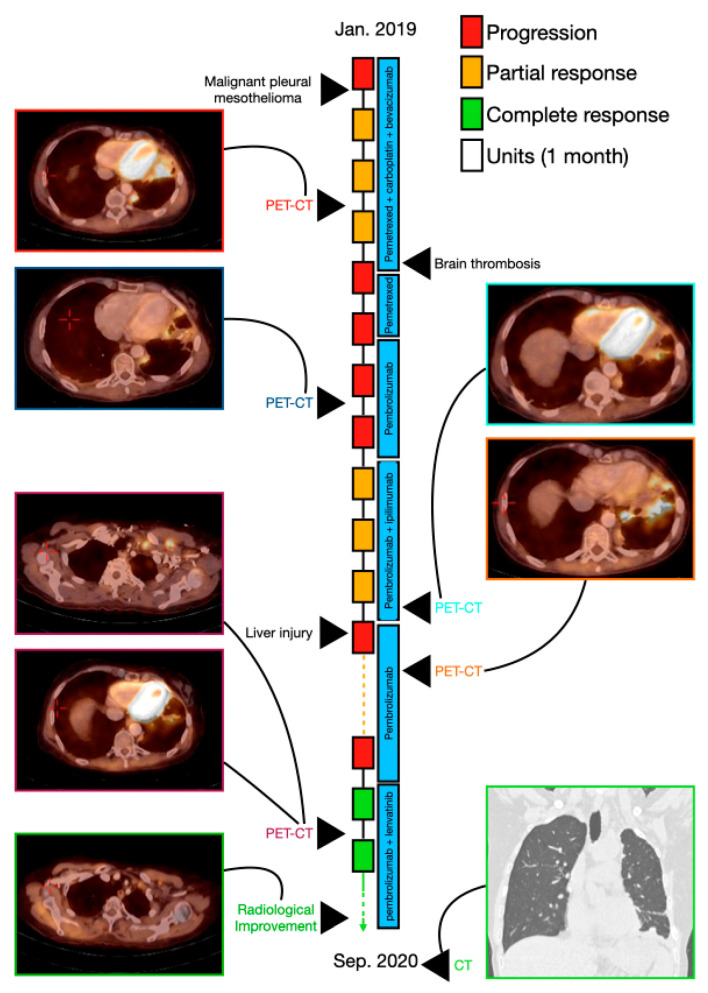
Figure 4.
A schematic illustration of patient 4′s timeline, between January 2019 (diagnosis of the disease) and September 2020, including the course of treatment and radiological follow-up. Each rectangle represents 1 month, and the response to treatment during each month is color-coded in green, red, or yellow, as described in the upper legend. Treatment administered in each timepoint is indicated by the blue rectangles. Radiological findings and additional landmarks are presented at relevant points throughout the timeline.

