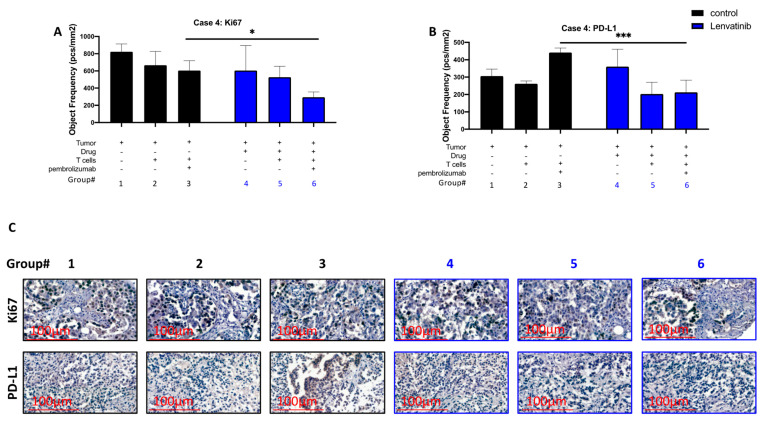
Figure 7.
Correlation between the multikinase inhibitor (lenvatinib) and the immune checkpoint inhibitor (pembrolizumab) treatments. A 3-dimensional (3D) ex vivo assay was performed as an i-TEVA assay on patient 4′s tumor and T cells: (A,B) lenvatinib (blue) was the experimental test, and the control (black) was untreated. From the 3D ex vivo assay, 5-µm FFPE sections were stained either for Ki67 (proliferation marker) or PD-L1 expression. A two-way ANOVA multiple comparisons test was performed among the groups for each patient individually, with three biologically independent counts in each group. * p = 0.0498; *** p = 0.0007. All statistical data analysis was performed using GraphPad Prism, version 8.0.2; (C) This figure shows representative pictures for each group from 1 to 6. Pictures were captured using CaseViewer 40× magnification at 300 dpi; scale bar is located at the left bottom corner, 100 μm (red).

