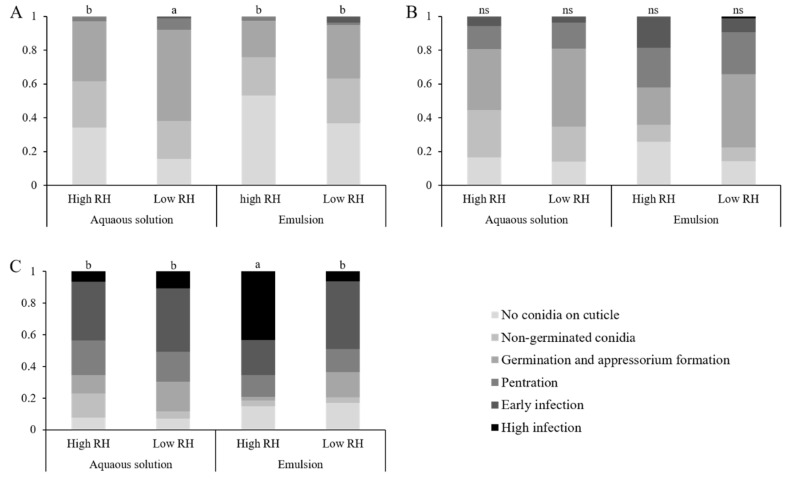
Figure 8.
Distribution of disease stages amongst larval cohorts (for sample size see Table 1) over time. Larvae were exposed to leaves treated with aqueous solution or emulsion-formulated conidia at high or low RH. Larvae were sacrificed daily and examined under a confocal microscope. The disease stage of every larva was recorded and shown above as a percent of the total larvae examined: (A) one DPI (B) two DPI (C) three DPI. An each-pair Wilcoxon test was employed, different lower-case letters indicate a significant difference between treatments, ns indicates no significant difference between treatments. p-values were then subjected to a Holm–Bonferroni family-wise error rate (FWER) correction (α < 0.05).

