Fig. 5.
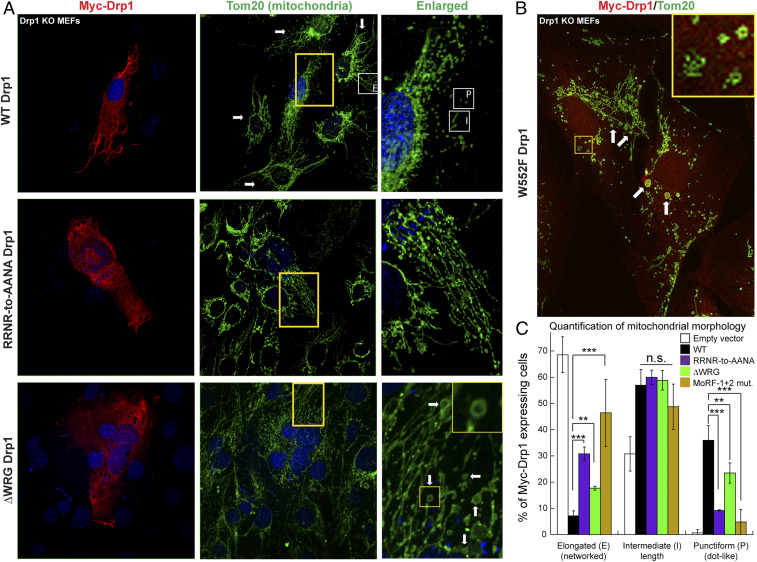
MoRF mutations impair fission and induce donut mitochondria formation. (A and B) Confocal immunofluorescence images of Drp1 KO MEFs expressing either Myc-WT Drp1 or mutants (red) and stained for mitochondria (green). Arrows in A, Top Middle point to hyperfused mitochondrial networks in untransfected Drp1 KO MEFs. Regions demarcated by yellow boxes are enlarged and shown to the right. Examples of elongated “E,” intermediate “I,” and punctiform “P” mitochondria are marked by white boxes in Top, Middle, and Right. (Insets) Donut mitochondria of various shapes and sizes prominently found in ΔWRG and W552F Drp1-expressing cells are pointed by arrows and are shown enlarged. (C) Classification of Myc-Drp1-expressing cells based on the predominant mitochondrial morphology displayed. Mean ± SD is plotted. Statistical significance was determined using two-way ANOVA with post hoc Tukey’s test for comparison of multiple groups. n.s. not significant, **P ≤ 0.01, ***P ≤ 0.001.

