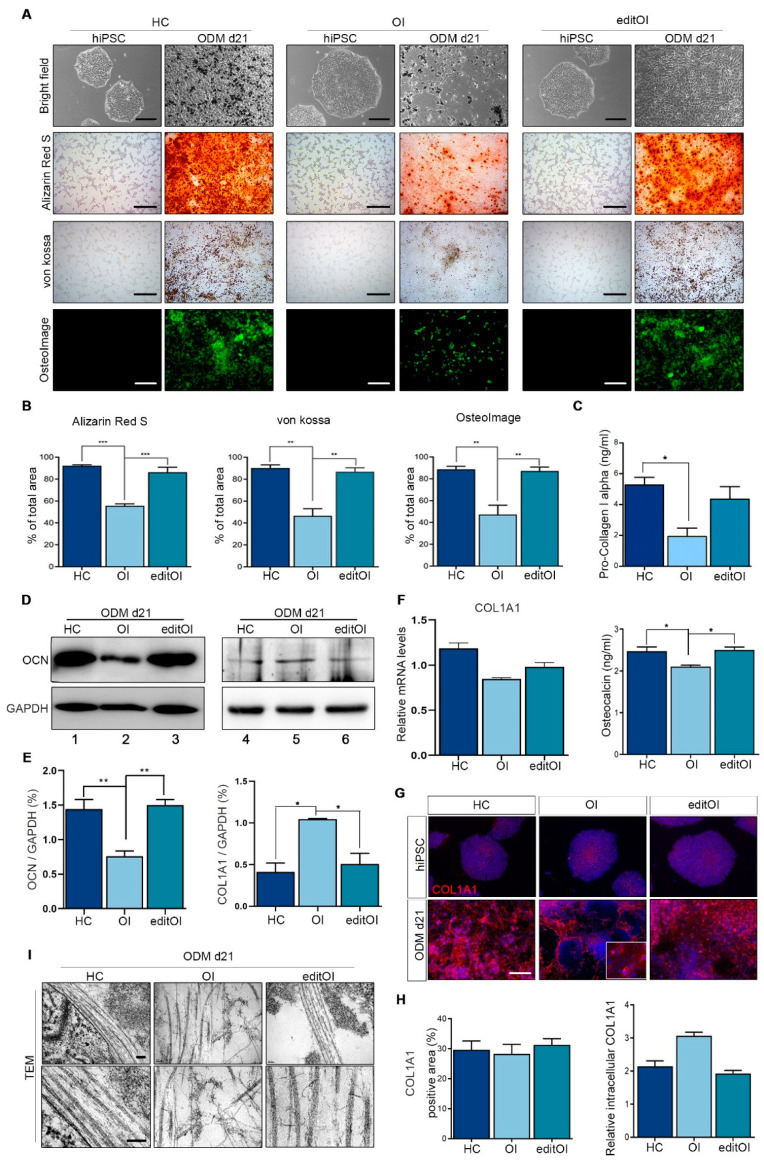
Figure 4.
Improvement of collagen structure stability and osteoblast differentiation of edited OI-iPSCs. editOI-iPSCs, OI-iPSCs, and HC-iPSCs were cultured in osteogenic differentiation medium for 21 days. (A) Observation of morphological features by bright-field microscopy. Osteoblastic (calcium phosphate) deposition by osteoblasts was measured by Alizarin Red S and von Kossa staining. The amount of hydroxyapatite was measured using the OsteoImage mineralization assay (scale bars: 100 µm). (B) Quantitative measurements of Alizarin Red S and von kossa using ImageJ software. The amount of hydroxyapatite was measured using the OsteoImage mineralization assay and quantified using the ImageJ software. The graphs show the mean values ± standard deviation of three independent experiments. Data were statistically analyzed using a one-way ANOVA. * p < 0.05; ** p < 0.01; *** p < 0.001. (C) Pro-Collagen I alpha and Osteocalcin levels were measured in the osteogenic differentiation supernatant. The graphs show the mean values ± standard deviation of three independent experiments. Data were statistically analyzed using a one-way ANOVA. * p < 0.05. (D) Representative western blot analysis of COL1A1 and OCN in cell lysates, with quantification. GAPDH was used as a loading control. (E) Western blot band quantification through image analysis software. Data were statistically analyzed using a one-way ANOVA. * p < 0.05; ** p < 0.01. (F) Quantitation of expression of osteogenic marker genes (COL1A1) in HC, OI, and editOI-iPSCs after 21 days of osteogenic differentiation. Data were statistically analyzed using a one-way ANOVA. * p < 0.05. (G) Representative images of immunostaining of type I collagen in HC-iPSCs, OI-iPSCs, editOI-iPSCs (scale bars: 100 µm). (H) Percentage of type I collagen positive area, as assessed using the ImageJ software. Quantification of intracellular type I collagen. The graphs show the mean values ± standard deviation of three independent experiments. Data were statistically analyzed using a one-way ANOVA. * p < 0.05. (I) Decrease in collagen production due to abnormal changes in the structure of type I collagen was confirmed by TEM images (scale bars: 300 nm).

