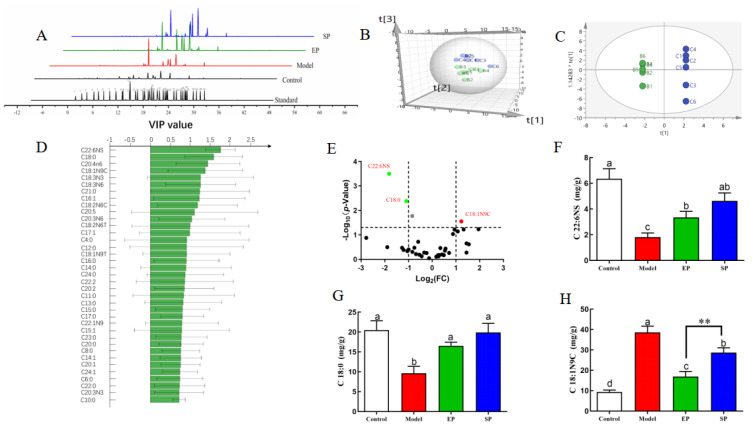
Figure 3.
Treatment with phospholipid changes in hepatic fatty acid profiles. (A) Total ion chromatogram of liver samples and 37 fatty acid methyl esters standard, (B) PCA score 3D plot and (C) OPLS-DA score plot, (D) VIP scores of OPLS-DA, and (E) volcano plot for liver fatty acids of normal and HFD-fed rats. Potential biomarkers of fatty acid metabolism in HFD rats: (F) C22:6NS; (G) C18:0 of mouse liver; and (H) C18:1N9C of mouse liver. Peaks of the total ion chromatogram: (1) C4:0, (2) C6:0, (3) C8:0, (4) C10:0, (5) C11:0, (6) C12:0, (7) C13:0, (8) C14:0, (9) C14:1, (10) C15:0, (11) C15:1, (12) C16:0, (13) C16:1, (14) C17:0, (15) C17:1, (16) C18:0, (17) C18:1N9T, (18) C18:1N9C, (19) C19:0, (20) C18:2N6T, (21) C18:2N6C, (22) C20:0, (23) C18:3N6, (24) C20:1, (25) C21:0, (26) C20:2, (27) C22:0, (28) C20:3N6, (29) C22:1N9, (30) C20:3N3, (31) C20:4N6, (32) C23:0, (33) C22:2, (34) C24:0, (35) C20:5, (36) C24:1, (37) C22:6NS. An HFD containing 2% egg PLs (egg yolk phospholipids group, EP), and an HFD containing 2% soy PLs (soybean phospholipids group, SP). The different letters indicate significant difference at p < 0.05 determined by ANOVA (Duncan’s test). ** p < 0.01 significant EP to SP determined by Student’s t-test.

