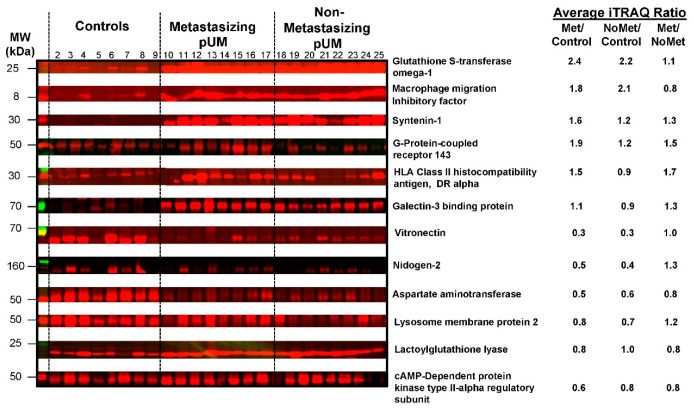
Figure 2.
Western blot analysis. Fluorescence immunoblot reactivity is shown for 12 proteins quantified by LC MS/MS iTRAQ technology in choroid control tissues (lanes 2–9), metastasizing pUM (lanes 10–17), and non-metastasizing pUM (lanes 18–25). Prior to blotting, sample amounts applied to SDS-PAGE (~10 μg) were equalized based on Coomassie blue staining intensities (see Supplementary Figure S2). Western blot immunoreactivity (Supplementary Figure S3) supports the average iTRAQ protein ratios shown for metastasizing pUM (Met/control), non-metastasizing pUM (NoMet/control), and Met pUM/NoMet pUM.

