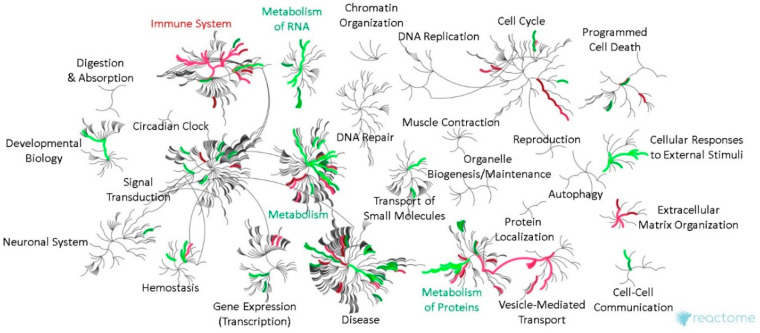
Figure 3.
Genome-wide overview of bioinformatic pathways in metastasizing and non-metastasizing pUM. Reactome pathway analysis results are illustrated in network view for DE proteins elevated in metastasizing pUM (n = 191, red) and for those elevated in non-metastasizing pUM (n = 211, green). Top level Reactome pathways are labeled and displayed in circular bursts, with each step away from the center representing a lower level in pathway hierarchy. The color coding reflects over-representation of the pathway and no color signifies little, if any, pathway representation. See Supplementary Tables S7 and S8 for pathway details.

