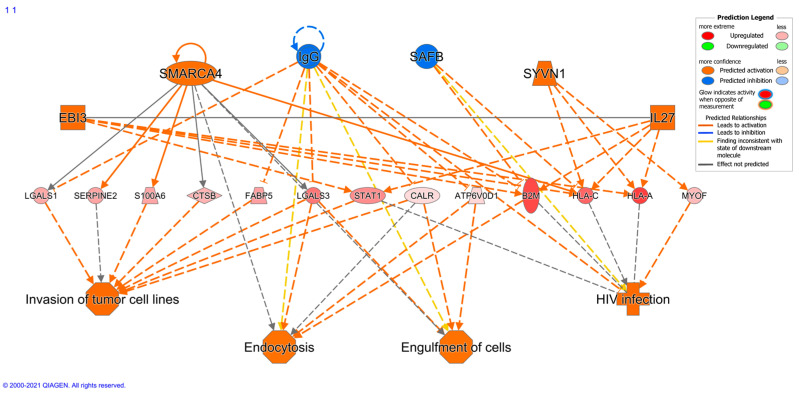
Figure 4.
Regulatory effects network. The above upstream regulator effects network was predicted by the IPA bioinformatic analysis of the 191 DE proteins elevated in metastasizing pUM. Symbols: circle, complex/group; square—cytokine; vertical oval—transmembrane receptor; horizontal oval—transcription regulator; trapezoid—transporter. Solid lines represent direct interactions; dashed lines represent indirect interactions. IPA predicted no regulatory effects network for DE proteins elevated in non-metastasizing pUM.

