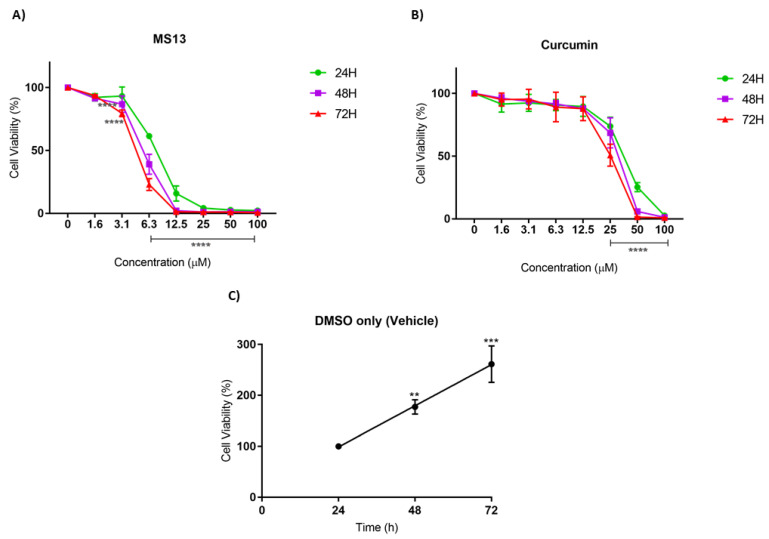
Figure 2.
The antiproliferative effects of (A) MS13 and (B) curcumin on NCI-H520 cell line at 24, 48, and 72 h. The experiments were performed in triplicate and results were compared between three independent experiments. Results are presented as means of percentage of cell viability and comparison between data sets were statistically analyzed using ANOVA. Vehicle-treated controls of DMSO (C) were included to assess cell growth in untreated NCI-H520 cells over time. Asterisks indicate statistically significant differences between the means of the values obtained with treated versus untreated cells (** p < 0.01, *** p < 0.001 and **** p < 0.0001).

