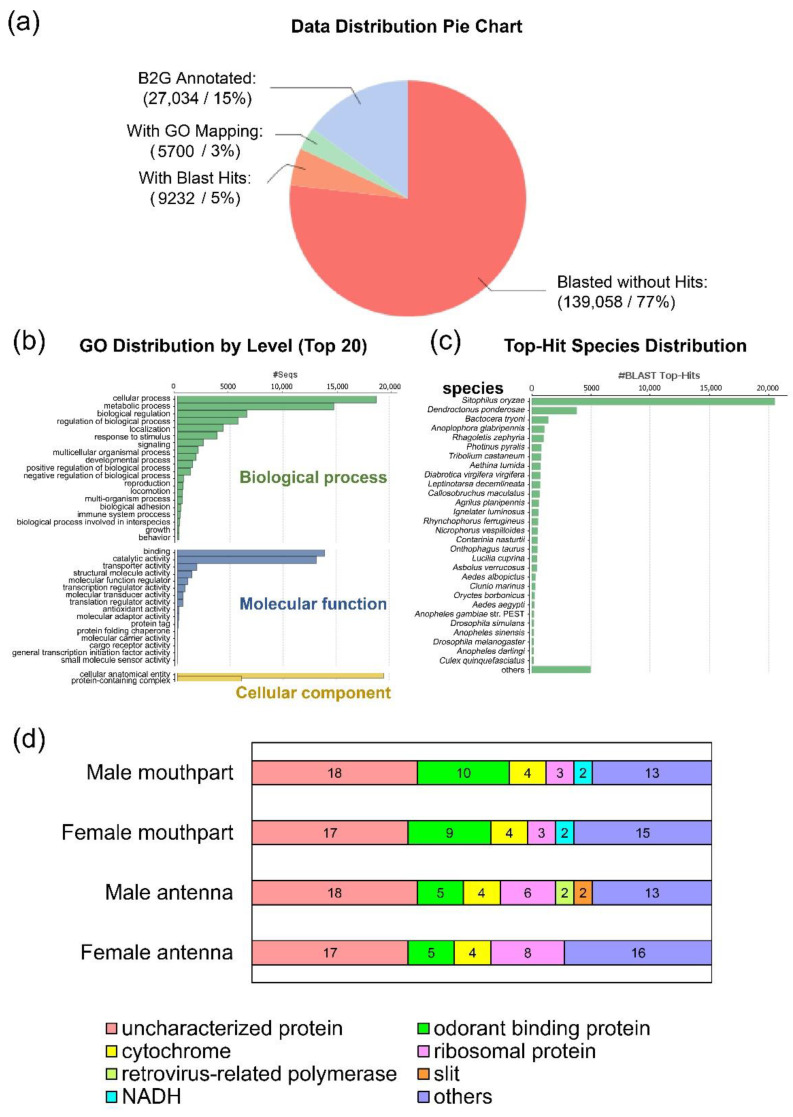
Figure 2.
Antennal and mouthpart transcriptome data (a) Data distribution of the Blast2GO result (b) Gene ontology distribution by level (top 20) (c) Top-hit species distribution (d) Top 50 most expressed genes in the four transcriptomes. Genes are grouped into main classes. Genes that are not classified into a group are included in ‘others’.

