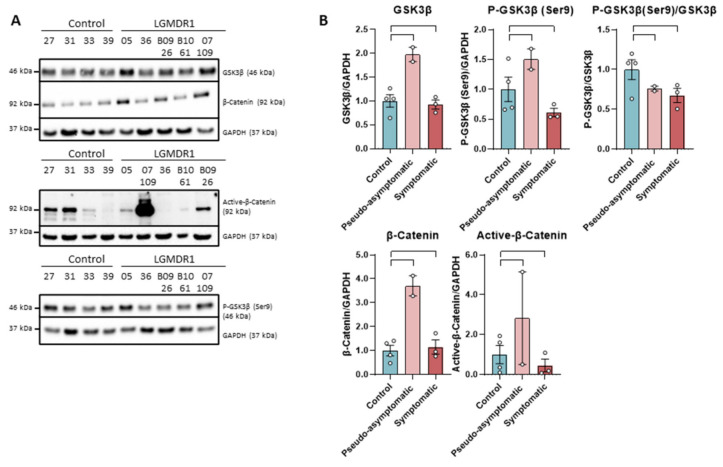
Figure 1.
Western blot (A) and densitometry analysis (B) of Wnt signaling pathway proteins in samples from muscles of LGMDR1 and controls: total GSK-3β, P-GSK-3β (Ser9), P-GSK-3β/GSK-3β, β-catenin and Active β-catenin. Control samples (n = 4), symptomatic patients (n = 3) and pseudo-asymptomatic patients (n = 2) (05 and 07-109). All error bars represent standard error of the mean (SEM). Each circle represents a sample. Loading control: GAPDH.

