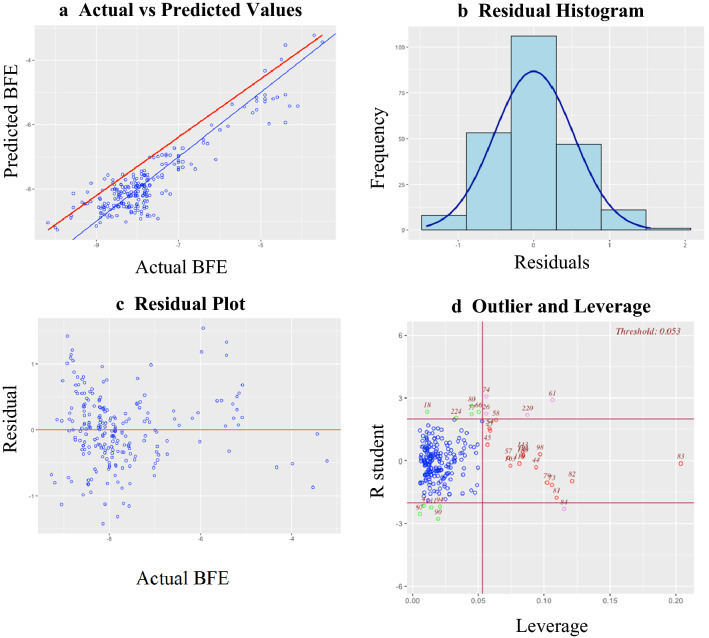
Fig. 2.
Results of diagnostics performed on the lasso regression model using the “olsrr” package. a The actual vs predicted values plot shows if the model is linear and how well the data points fit the regression line. b Residual histogram checks if the residuals are normally distributed. c The residual plot shows if the model is homoscedastic. d Outlier and leverage plot detects the observations influencing the model. Blue points are normal, red points are leverages, green points are outliers, and pink points are both outliers and leverages

