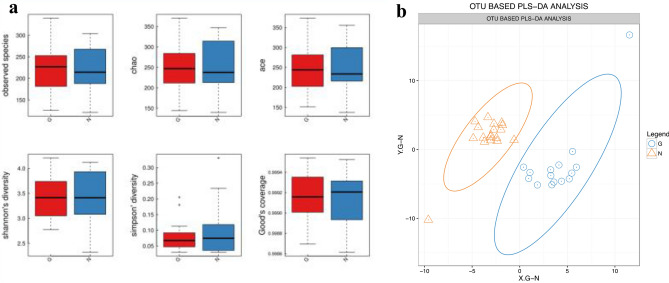
Fig. 2.
Alpha diversity and beta diversity between the GDM and control groups. a Alpha diversity analysis between gestational diabetes mellitus (GDM) and normal glucose tolerance (NGT) groups. The five lines from the bottom to the top are the minimum, first quartile, median, third quartile, and maximum, respectively. b OTU-based partial least-squares discrimination analysis (PLS-DA). The large ovals indicate good aggregation and significant differentiation between the GM structures of the GDM and NGT groups (G: GDM; N: NGT)

