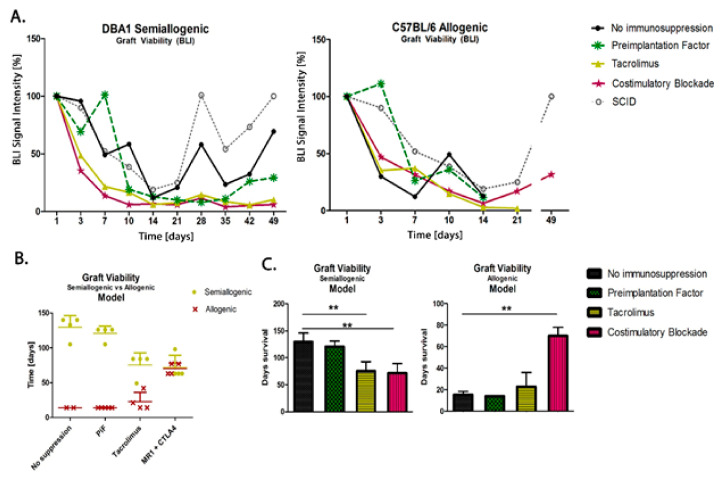
Figure 7.
Comparison of graft survival in semiallogenic DBA1 and allogenic C57BL/6 mouse models: (A) Graphic presentation of GRP graft viability (presented as the proportion out of initial BLI as 100% of intensity signal) transplanted into healthy models in semiallogenic (left) and allogenic (right) combinations. (B) Graphic presentation of cellular graft viability in semiallogenic (yellow dots) and allogenic (red crosses) mouse models after performed GRP transplantation. The murine GRP graft survived well in semiallogenic mice even if no immunosuppression was applied. The graft survival in the allogenic model was the longest and comparable to the semiallogenic model after the co-stimulatory molecules blockade. (C) Bar graphics of graft survival in semiallogenic mouse model (right) as compared with different groups of immunosuppressive/immunomodulatory regimens (** p < 0.005). Unpaired Student’s t-test; data are presented as median, error bars: SD; the total number of biological replicates per group = 4–5. Abbreviations: BLI-bioluminescence imaging; GRP-glial-restricted progenitor cell.

