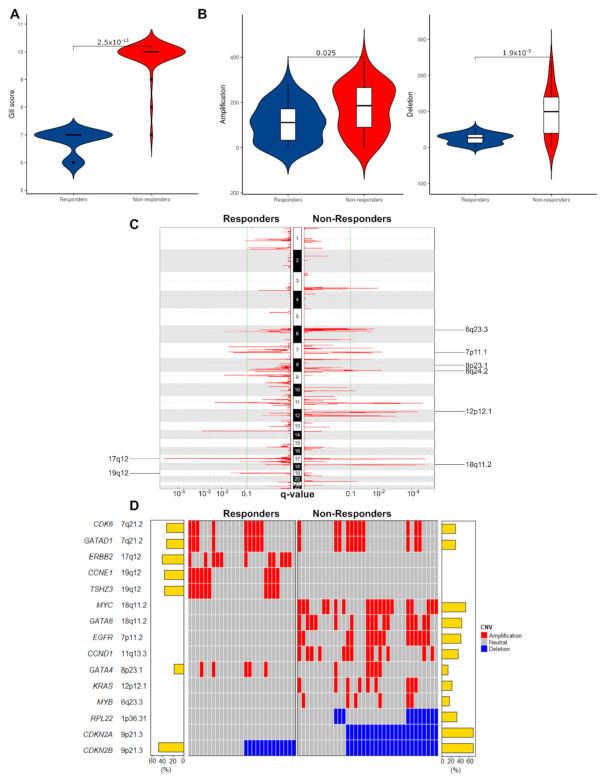
Figure 3.
Non-responders have less stable genomes and unique patterns of copy number change in EAC driver genes. (A) Proportions of the genome affected by copy-number changes (Genomic Instability Index, GII). Non-responders showed a higher level of genomic instability (p = 2.5 × 10⁻¹³). (B) Violin plots depicting the frequency of all amplifications and deletions in responders and non-responders. (C) Amplified peak regions across the genome plotted for responders vs non-responders (n = 63) using GISTIC2.0 (FDR < 0.1). Amplifications unique to each group are labeled. (D) Oncoplot of recurrently amplified/deleted EAC drivers among responders and non-responders identified by GISTIC2.0 (FDR < 0.1).

