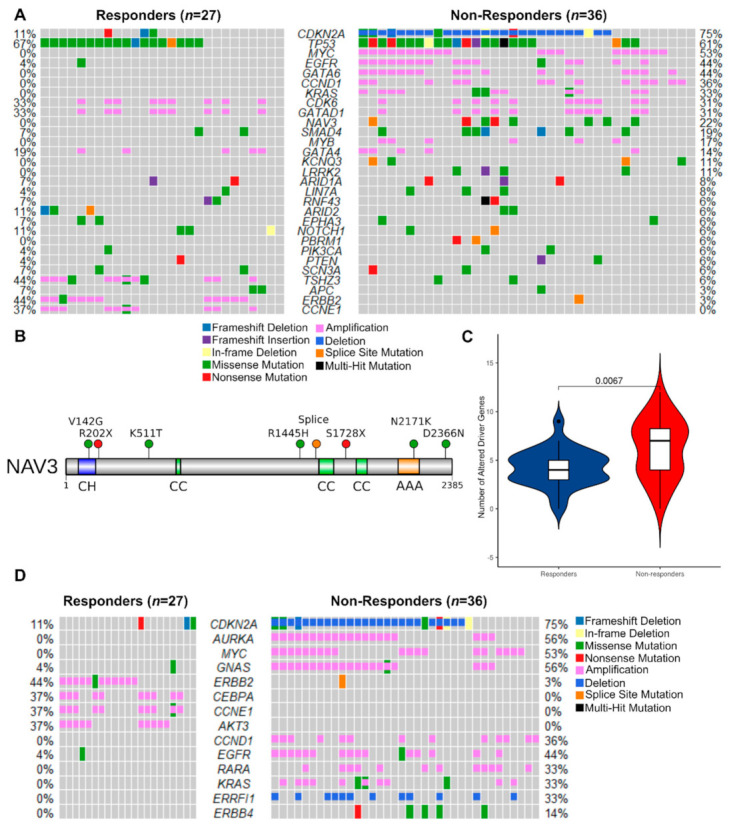
Figure 5.

Non-responders have more EAC driver alterations of all types, including exclusive mutation of the tumor suppressor NAV3. (A) Oncoplot of SNVs, indels and CNVs combined in responders vs. non-responders (n = 63). Genes shown are the subset of the 76 EAC driver genes described in Frankell et al. [25] that were mutated in at least 5% of either group. Percentages of responders or non-responders with driver gene mutations are shown next to the corresponding row. (B) Protein-level diagram of mutations in the coding sequence of NAV3, which was exclusively mutated in non-responders. Domains are labeled as follows: CH—calponin homology; CC—coiled coil; AAA—ATPase associated with diverse cellular activities. Mutational sites are shown as lollipops color-coded according to the type of mutation. (C) Violin plots comparing frequency of all alterations (SNVs, indels and CNVs) in EAC driver genes per sample in responders vs. non-responders. (D) Oncoplot of SNVs, indels and CNVs combined in TARGET database genes, which are associated with a clinical action in cancer (n = 63). Genes that were mutated in at least 5% of either group are shown.
