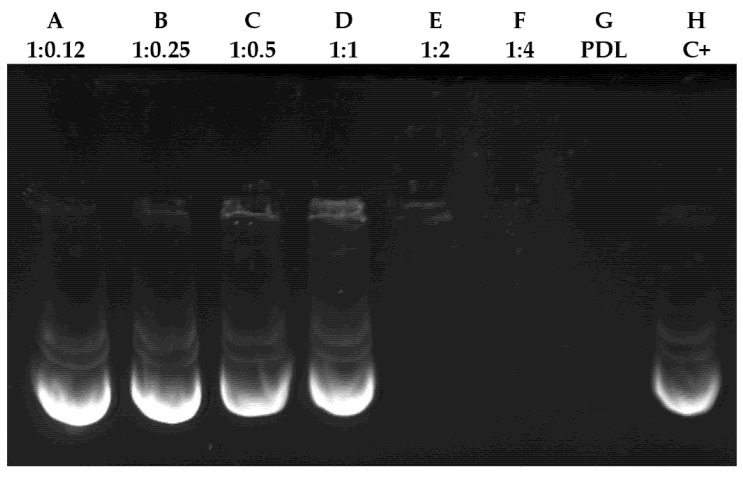
Figure 1.
Interaction analysis between different plasmid/PDL ratios. Interaction analysis of plasmid–PDL complex at different ratios in agarose gel (0.8%) stained with GreenSafe. Columns A–F show the different plasmid/PDL ratios used (1:012, 1:0.25, 1:05, 1:1, 1:2, 1:4 and 1:8 respectively). Column G only contains PDL and column H was used as a positive control where only DNA was inserted.

