Figure 5.
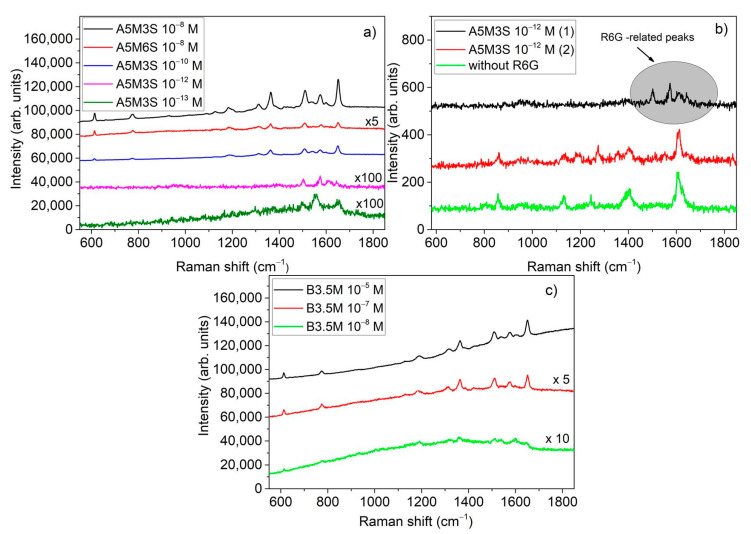
Raman spectra obtained from: (a) A5M3S and A5M6S for R6G concentrations in the range 10−8–10−13 M, (b) obtained from two different locations (1, 2) on A5M3S at R6G concentration of 10−10 M and compared with that obtained from a similar substrate without R6G, (c) B3.5M for RG6 concentrations in the range 10−5–10−8 M.

