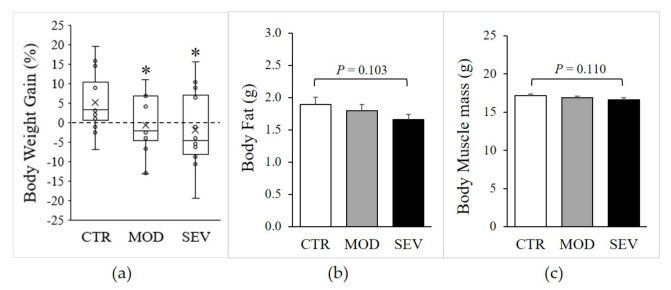
Figure 2.
Body composition of mice fed Mg2+-deficient diet. Mice were fed either a control (CTR), a mildly (MOD), or a severely (SEV) Mg2+-deficient diet: (a) body weight, data (N = 12) presented as box-and-whisker plots, (b) body fat, and (c) body muscle mass were determined by EcoMRI; results are means + SE (N = 12). * Significant difference (P < 0.05) from the CTR group.

