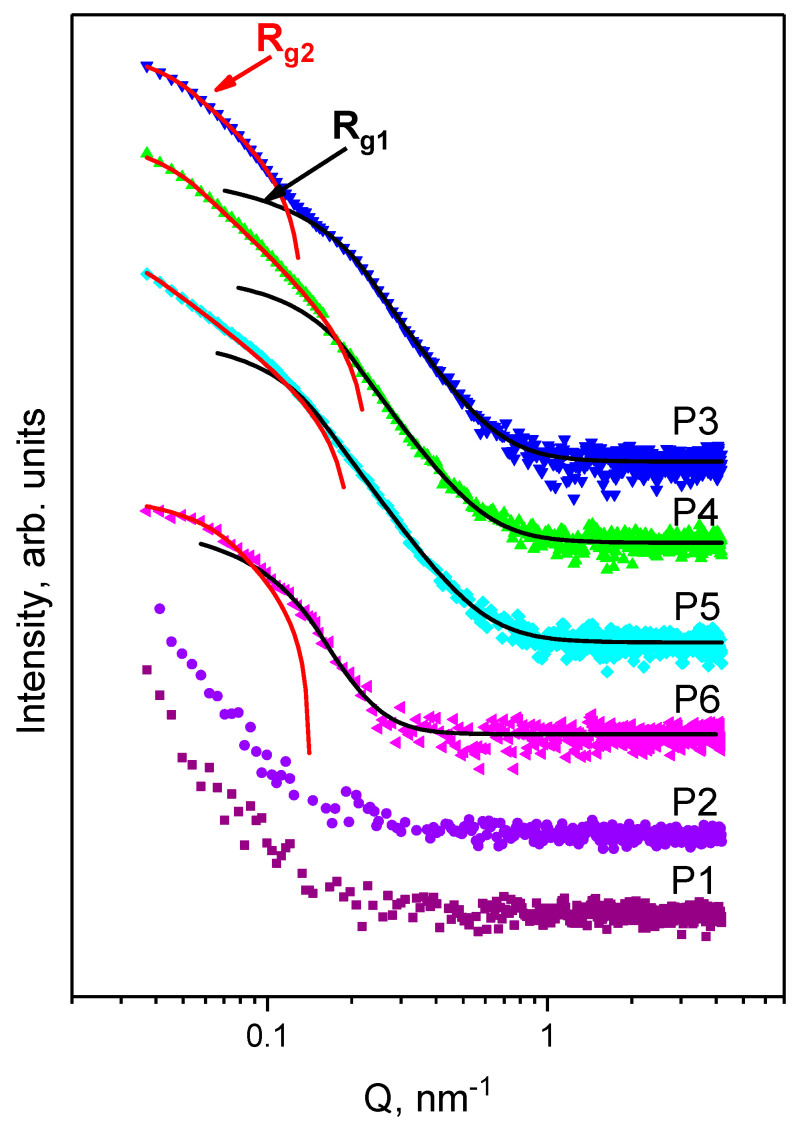
Figure 4.
SAXS curves for Samples P1–P6 in excess PBS medium: P1—Lip (purple), P2—Lip–CTS (violet), P3—Ag/AgClNPs (blue), P4—Ag/AgClNPs–CTS (green), P5—Ag/AgClNPs–Lip (cyan) and P6—Ag/AgClNPs–Lip–CTS (magenta). Symbols are experimental data, and lines are fits by the generalized Guinier–Porod model (Equation (1) in the Supplementary Materials). For better visualization, the curves are spaced with a coefficient of 10 relative to each other in the intensity scale from the bottom to the top.

