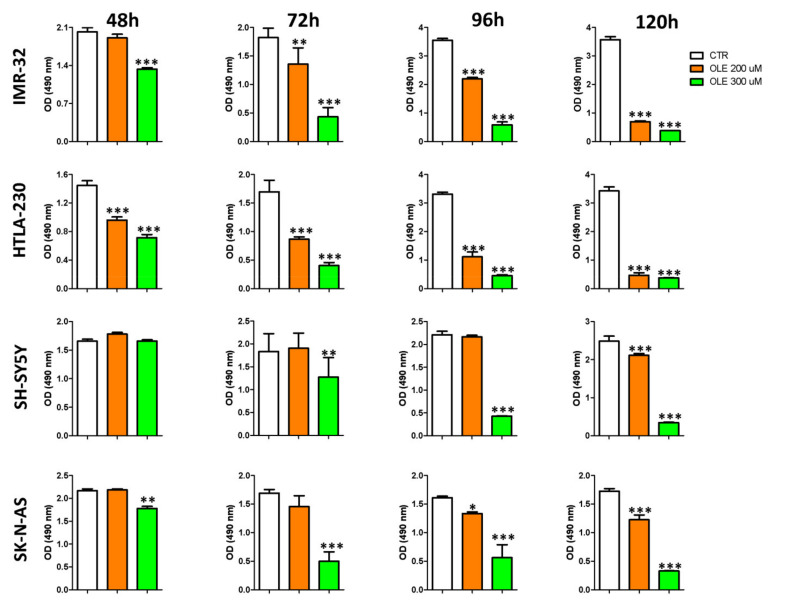
Figure 2.
Time-dependent effects of OLE treatment on the cell viability of NB cells. The MTS assay was performed after 48, 72, 96, and 120 h of OLE treatment. Optical density (OD, at 490 nm) was recorded by the use of the TECAN micro-plate reader, Infinite 200 (Tecan Life Sciences). Data are expressed as mean ± SD of three independent experiments (* p < 0.05, ** p < 0.01, *** p < 0.001 vs. CTR). CTR: control; OLE: olive leaf extract; uM: micromolar; h: hours; nm: nanometer.

