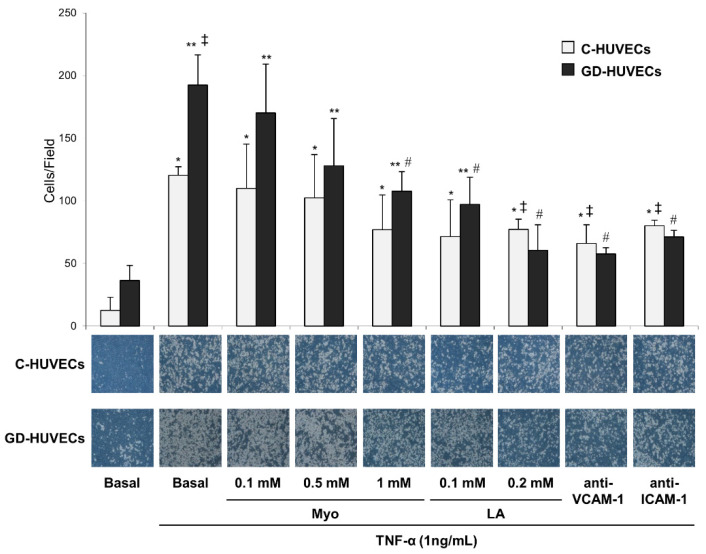
Figure 2.
Effect of in vitro treatment with Myo on TNF-α-induced monocyte interaction in C- and GD-HUVECs. In the lower side are representative photos of C- and GD-HUVECs for each experimental condition. * p < 0.01 vs. Basal C-HUVECs, ** p < 0.005 vs. Basal GD-HUVECs, ‡ p < 0.05 vs. TNF-α C-HUVECs, # p < 0.05 vs. TNF-α GD-HUVECs.

