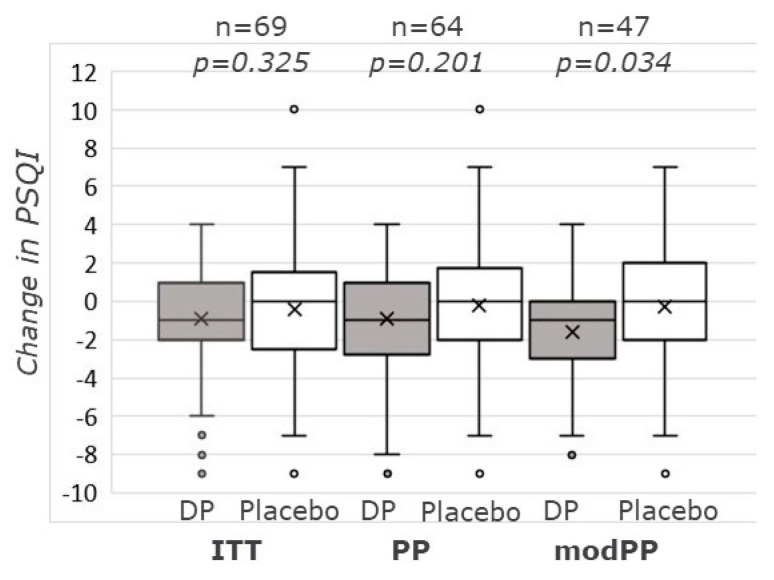
Figure 2.
Changes in PSQI from baseline to day 14, for the ITT, PP, and modPP populations. Box-Whisker plot showing median, first (Q1) and third (Q3) quartile, and mean value (X). Whiskers are 1.5 times inter quartile range (IQR = Q3–Q1)) or maximum/minimum values when these are within the 1.5 IQR range. Outliers (beyond the 1.5 times IQR) are presented as single dots. p-values are based on independent-samples t-test. DP: Dairy-based test product. Placebo: skimmed milk. PSQI: Pittsburgh Sleep Quality Index.

