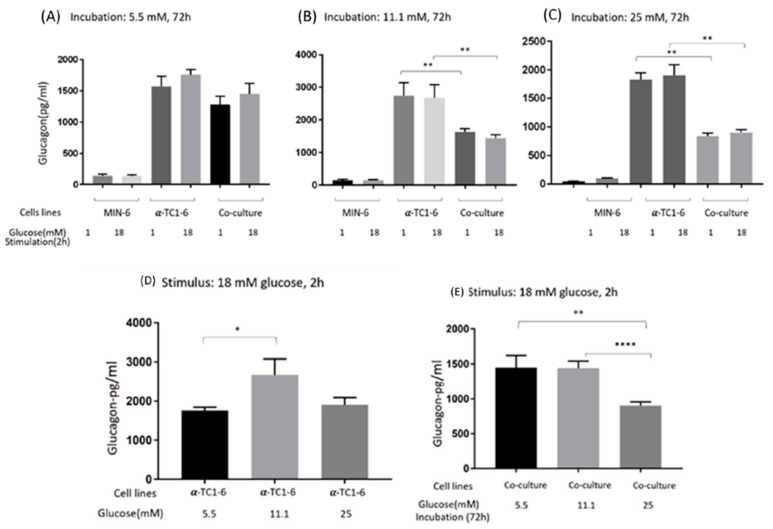
Figure 2.
Glucagon secretion from mono- or co-cultured MIN-6 and α-TC1-6 cells when stimulated with low (1mM) or high (18 mM) glucose after 72 h incubation in (A) 5.5, (B) 11.1, or (C) 25 mM. (D) Glucagon secretion from α-TC1-6 cells when stimulated with high glucose after 72 h incubation in 5.5 mM, 11.1, or 25 mM glucose. (E) Glucagon secretion from co-cultured cells when stimulated with high (18 mM) glucose after 72h incubation in 5.5, 11.1, or 25 mM glucose. Data are presented as the mean ± SEM of 18 samples per condition from three independent experiments. * p < 0.05, ** p < 0.01, **** p < 0.0001.

