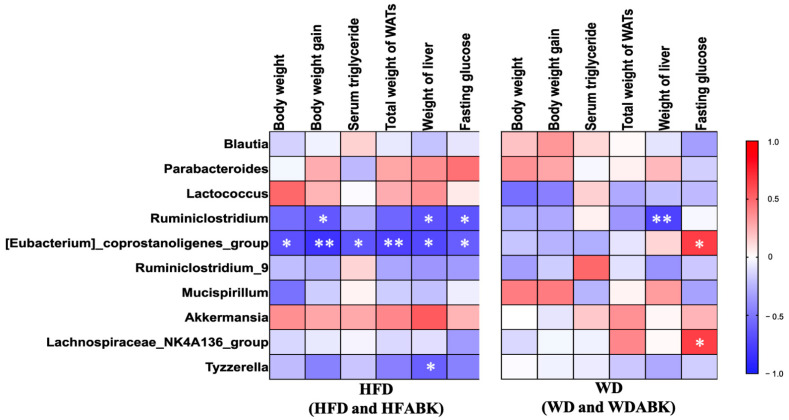
Figure 8.
Spearman’s rank correlations between the top ten abundant bacterial genera and obesity-related parameters within HFD-fed mice (HFD and HFABK, n = 12) and WD-fed mice (WD and WDABK, n = 12). Spearman’s correlation analysis with an R value > 0.4 indicates a positive correlation (red color) and a value <−0.4 indicates negative correlation (blue color). * p < 0.05, ** p < 0.01.

