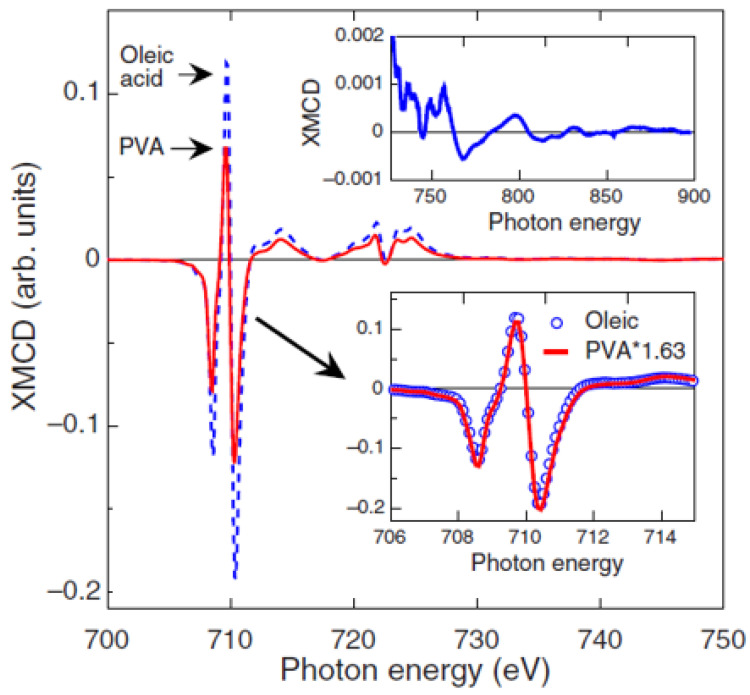
Figure 2.
XMCD curves at the L2,3 Fe edges recorded on the oleic acid (dashed blue line) and PVA (solid red line) samples. Upper inset: detail of the high-energy XMCD curve of the oleic acid sample. Bottom inset: detail of the scaling of the XMCD curves at the Fe L3 edge measured on both samples. The Figure is reprinted with permission from Ṕrez et al. [30].

