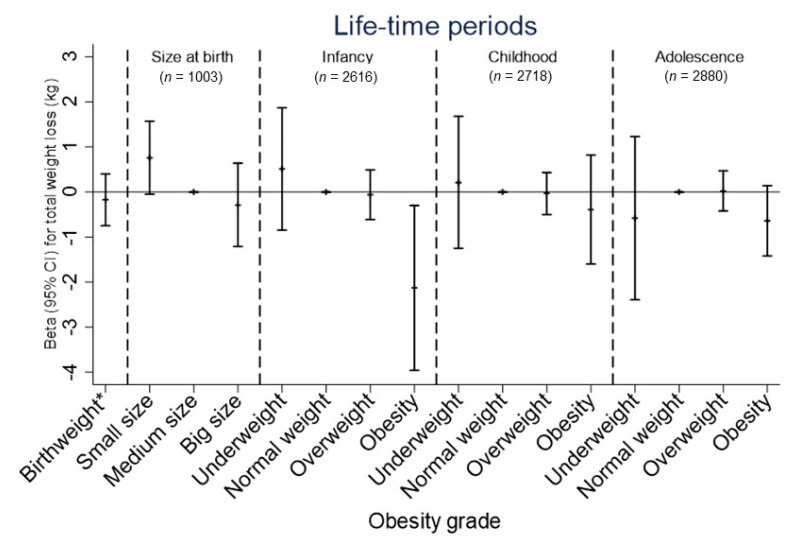
Figure 1.
Associations between birth weight, size at birth, and personal life-course obesity grade with total weight loss (kg) in response to the intervention. Lines represent beta coefficient and 95% CI derived from linear regression models. All models adjusted for sex, age, nutritional clinic, year of assessment, and initial body weight. * For birth weight, the coefficient represents the change in total weight loss (kg) as continuous per 1-kg increase in birthweight. For size at birth, a medium size represents the reference category. For infancy, childhood and adolescence periods, a normal weight represents the reference category; p-value for infancy obesity grade = 0.023.

