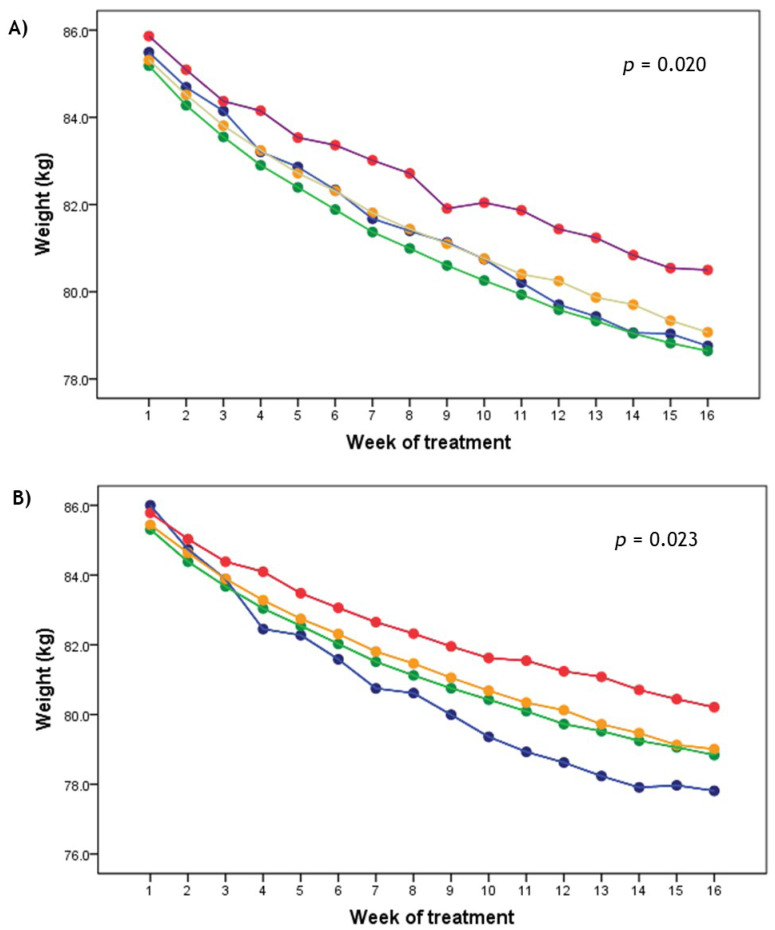
Figure 2.
Total weight loss evolution by categories of obesity grade in infancy (A) and childhood (B) during treatment. A repeated-measures analysis of variance (ANCOVA) was performed. Analyses were adjusted for sex, age, nutritional clinic, year of assessment, and initial body weight. Blue line = underweight; green line = normal weight; yellow line = overweight; red line = obesity.

