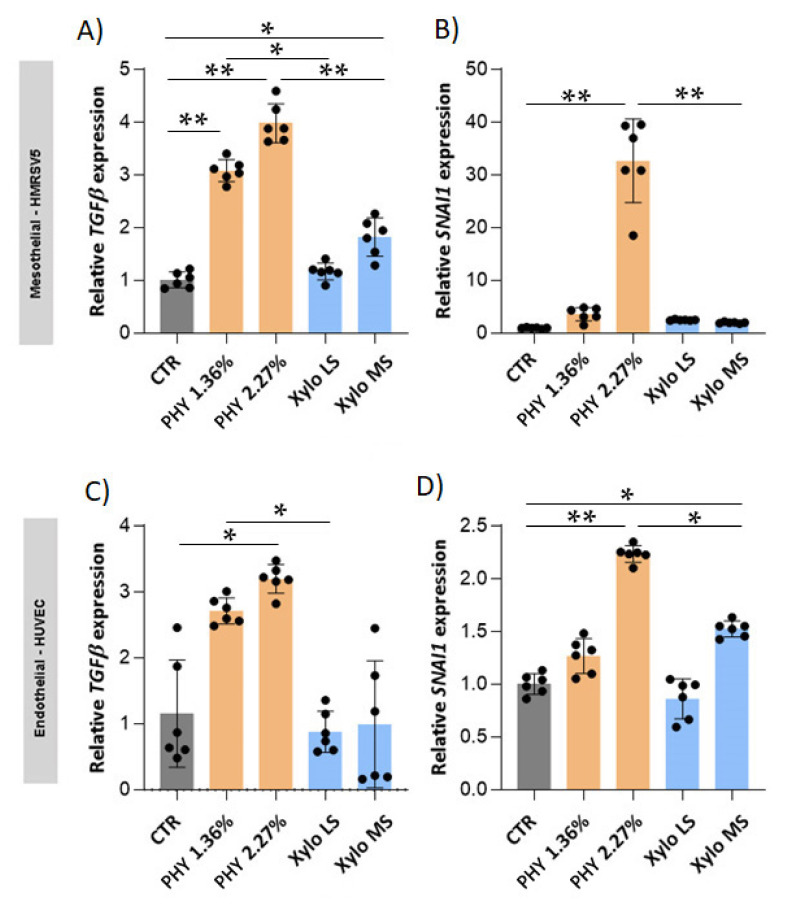
Figure 5.
SNAI1 and TGF-β expression in mesothelial and endothelial cells. TGF-β (A,C) and SNAI1 (B,D) gene expression was quantified by real-time PCR. The analysis was performed in HMRSV5 mesothelial cells (A,B) and in HUVEC endothelial cells (C,D) treated for 3 h in PD or control solution and then recovered with complete medium for 24 h. The results were normalized using ACTIN as an internal control and represent the mean ± S.D. (error bars) (n = 6 biological replicates). (A) CTR vs. PHY 1.36% p < 0.0001, CTR vs. PHY 2.27% p < 0.0001, CTR vs. Xylo MS p = 0.0026, PHY 1.36% vs. Xylo LS p = 0.0019, PHY 2.27% vs. Xylo MS p < 0.0001; (B) CTR vs. PHY 2.27% p < 0.0001, PHY 2.27% vs. Xylo MS p < 0.0001; (C) CTR vs. PHY 2.27% p = 0.0053, PHY 1.36% vs. Xylo LS p = 0.0016; (D) CTR vs. PHY 2.27% p < 0.0001, CTR vs. Xylo MS p = 0.0095, PHY 2.27% vs. Xylo MS p = 0.0016. * p < 0.05, ** p < 0.001.

