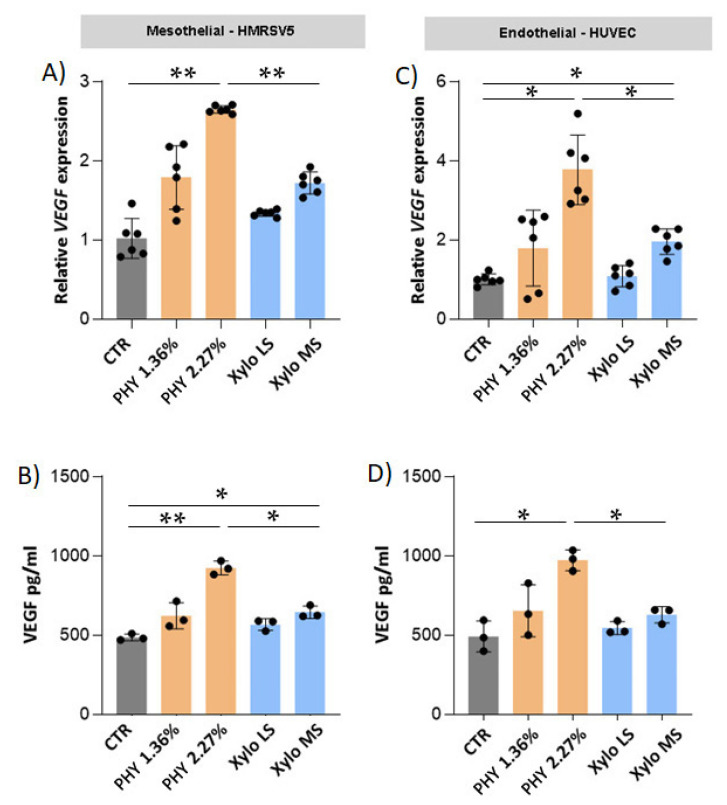
Figure 9.
Expression and release of VEGF by endothelial and mesenchymal cells. (A,C) VEGF gene expression. The analysis was performed as described in Figure 5. (A) CTR vs. PHY 2.27% p < 0.0001, PHY 2.27% vs. Xylo MS p < 0.0001; (C) CTR vs. PHY 2.27% p = 0.0056, CTR vs. Xylo MS p = 0.0092, PHY 2.27% vs. Xylo MS p = 0.0078 * p < 0.05, ** p < 0.001. (n = 6 biological replicates) VEGF soluble protein was quantified in conditioned medium obtained after 24 h of incubation of HMRSV5 mesothelial cells (B) and in HUVEC endothelial cells (D) pre-treated for 3 h in PD or control solution. Values are given as mean ± SD. (B) CTR vs. PHY 2.27% p < 0.0001, CTR vs. Xylo MS p = 0.0158, PHY 2.27% vs. Xylo MS p = 0.0012; (D) CTR vs. PHY 2.27% p = 0.0066, PHY 2.27% vs. Xylo MS p = 0.0076. * p < 0.05, ** p < 0.001 (n = 3 biological replicates).

