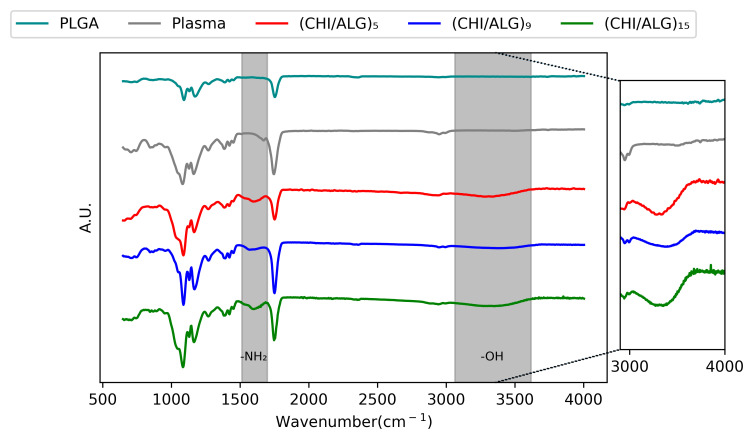
Figure 3.
AT-FTIR of PLGA, plasma-coated, (CHI/ALG)5, (CHI/ALG)9, and (CHI/ALG)15 electrospun nanofibers. The inset highlights the differences between the peaks in the 3000–4000 cm−1 region corresponding to the alcohol function present on both alginate and chitosan polymeric backbones. The region from 1550 to 1650 cm−1 describes the apparition of the amino function present in the chitosan polymeric backbone.

