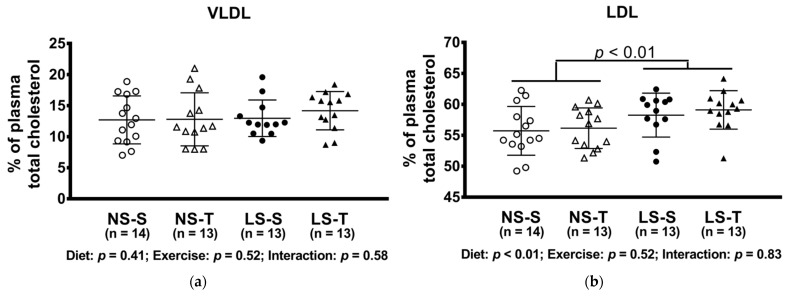
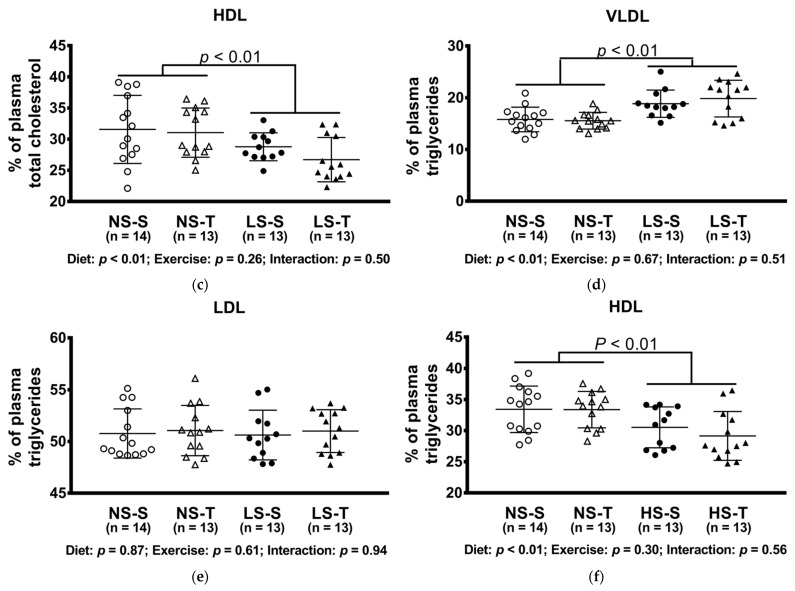
Figure 4.
Percentual of plasma lipids in lipoproteins determined by FPLC. (a) VLDLc; (b) LDLc; (c) HDLc; (d) VLDLtg; (e) LDLtg; (f) HDLtg. Data presented as mean ± SD. Results compared by 2-way ANOVA (GLM; fixed factor: diet and exercise) with Tukey’s post hoc test. p values show differences between diets. NS = normal-sodium diet; LS = low-sodium diet; S = sedentary; T = trained.


