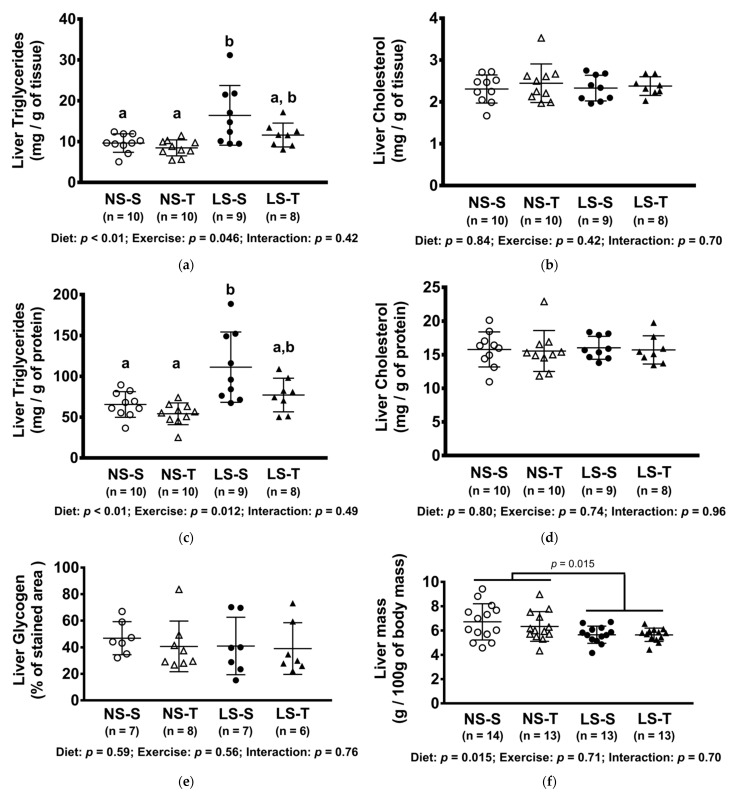
Figure 5.
Concentration of hepatic lipids and glycogen, and liver mass. (a) Triglycerides (mg/g of tissue); (b) cholesterol (mg/of tissue); (c) triglycerides (mg/g of protein); (d) cholesterol (mg/g of protein); (e) glycogen (% of stained area); (f) liver mass (g/100 g of body mass). Data presented as mean ± SD. Results compared by 2-way ANOVA (GLM; fixed factor: diet and exercise) with Tukey’s post hoc test. Distinct letters represent statistical differences between groups (p < 0.05). NS = normal-sodium diet; LS = low-sodium diet; S = sedentary; T = trained.

