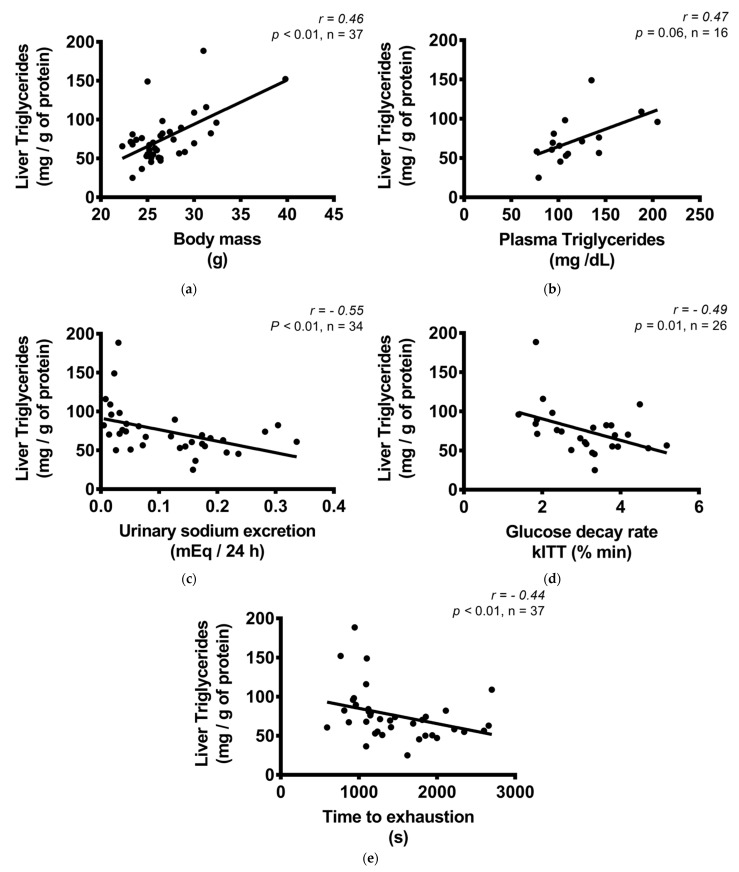
Figure 6.
Correlation between liver triglycerides (mg/g of protein) and body mass, biochemical variables, and exercise treadmill test. (a) Liver triglycerides (mg/g of protein) and body mass (g); (b) liver triglycerides (mg/g of protein) and plasma triglycerides (mg/dL); (c) liver triglycerides (mg/g of protein) and urinary sodium excretion (mEq/24 h); (d) liver triglycerides (mg/g of protein) and glucose decay rate, kITT (% min); (e) liver triglycerides (mg/g of protein) and time to exhaustion in treadmill exercise test (s). Correlations were performed by the Spearman’s rank correlation test.

