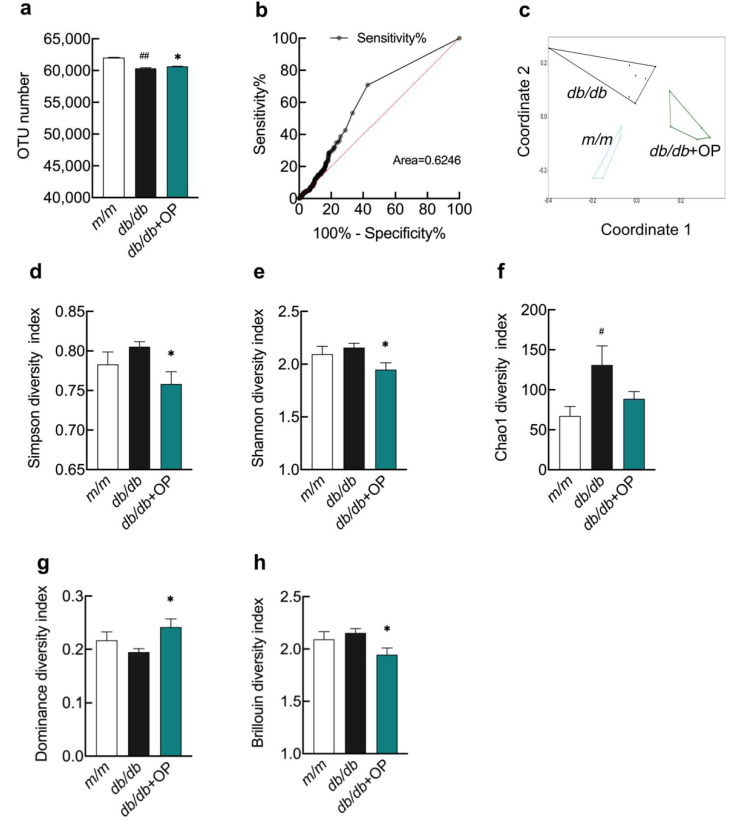
Figure 4.
The effects of OP treatment on α-diversity and β-diversity of gut microbiota in db/db mice. (a) OTU numbers of m/m group mice, db/db group mice, and db/db + OP group mice; (b) The ROC curve; (c) NMDS plot based on the Bray–Curtis distances; (d–h) The α-diversity analysis, including Simpson, Shannon, Chao1, Dominance, and Brillouin diversity. # p < 0.05, db/db versus m/m; ## p < 0.01, db/db versus m/m. * p < 0.05, db/db + OP versus db/db.

